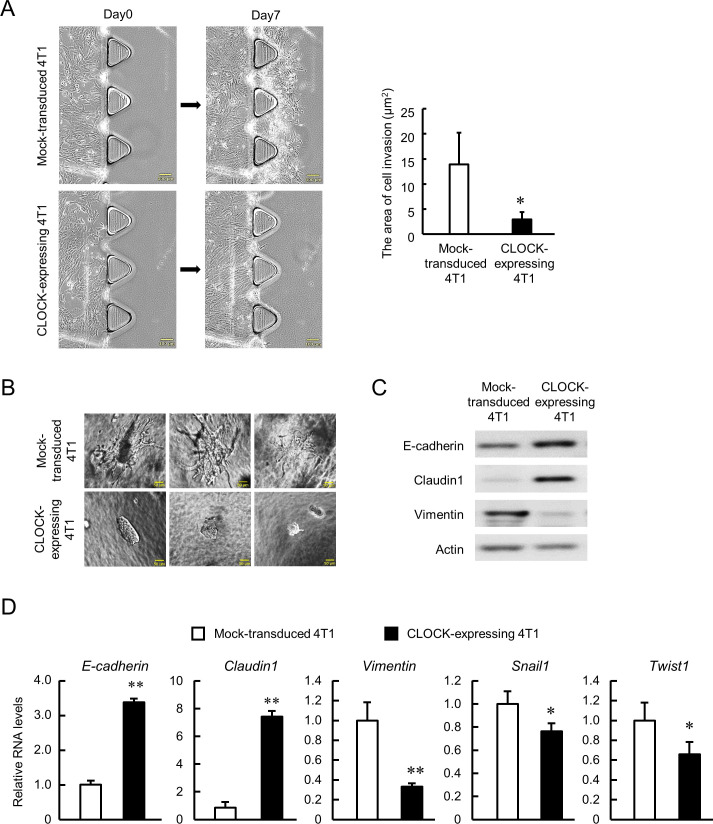
Figure 3. Suppression of invasive potential of 4T1 cells by CLOCK.
(A) Decrease in the invasion ability of CLOCK-expressing 4T1 cells. Microphotographs show invasion of cells into 3D collagen gel. The right panel shows difference in the invasion area between mock-transduced and CLOCK-expressing 4T1 cells. Values show mean with SD (n = 3). *p<0.05; significant difference from mock-transduced 4T1 cells (t4 = 2.968, Student’s t-test). (B) Representative microphotographs of spheroid invasion by mock-transduced and CLOCK-expressing 4T1 cells. Invasive morphology was detected by mock-transduced 4T1 cells. (C) Difference in the expression of adhesion molecules between mock-transduced and CLOCK-expressing 4T1 cells. (D) Differential expression of EMT-related molecules between mock-transduced and CLOCK-expressing 4T1 cells. E-cadherin and Claudin1 indicate the ‘epithelial’ state, and Vimentin, Snail1, and Twist1 indicate the ‘mesenchymal’ state. Data were normalized by the 18s rRNA levels. Values show the mean with SD (n = 3). The values of the mock-transduced group are set at 1.0. **p<0.01, *p<0.05; significant difference compared with mock-transduced 4T1 cells (t4 = 28.550 for E-cadherin; t4 = 18.159 for Claudin1; t4 = 6.233 for Vimentin; t4 = 2.873 for Snail1; t4 = 2.881 for Twist1; Student’s t-test).

