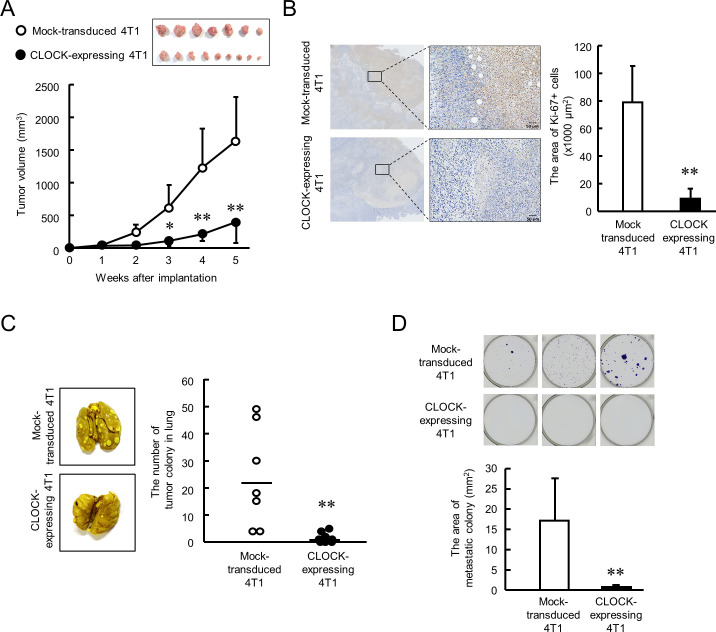
Figure 4. CLOCK-induced suppression of malignancy of 4T1 tumors in mice.
(A) The ability of tumor growth in mice implanted with mock-transduced or CLOCK-expressing 4T1 cells. Top panel shows the photograph of tumor burden isolated from each 4T1 cell implanted mice 6 weeks after implantation. Values are the mean with SD (n = 8–9 animals). **p<0.01; *p<0.05, significant difference compared with mock-transduced 4T1 cell-implanted mice at corresponding time points (F9, 67 = 19.956, p<0.001; two-way ANOVA with the Tukey–Kramer test). (B) Immunohistochemical staining of Ki-67 in mock-transduced or CLOCK-expressing 4T1 tumors. Complexes with Ki-67 and antibodies were visualized by 3, 3’-diaminobenzidine (brown), and nuclei were stained with hematoxylin (blue). Scale bars indicate 50 µm. Values show mean with SD (n = 6 animals). **p<0.01; significant difference from mock-transduced 4T1 cells (t10 = 6.213, Student’s t-test). (C) The number of pulmonary tumor colonies in mice implanted with mock-transduced or CLOCK-expressing 4T1 cells. Pulmonary colonies were assessed 6 weeks after implantation. The left panels show representative photographs of pulmonary tumor colonies of mock-transduced or CLOCK-expressing 4T1 cells implanted in mice. Right panel shows the quantification of the number of tumor colonies in lungs (n = 7–9 animals). **p<0.01; significant difference from mock-transdaced 4T1 (t14 = 3.601; Student’s t-test). (D) The number of metastatic colonies isolated from tumor-bearing mice femora bone marrow. The top panels show the representative photograph of tumor colonies stained by crystalbiolet. The bottom panel shows the quantification of the area of tumor colonies. Values show mean with SD (n = 8 animals). **p<0.01; significant difference from mock-transduced 4T1 cells (t14 = 3.871, Student’s t-test).

