. 2021 Apr 23;10:e66155. doi: 10.7554/eLife.66155

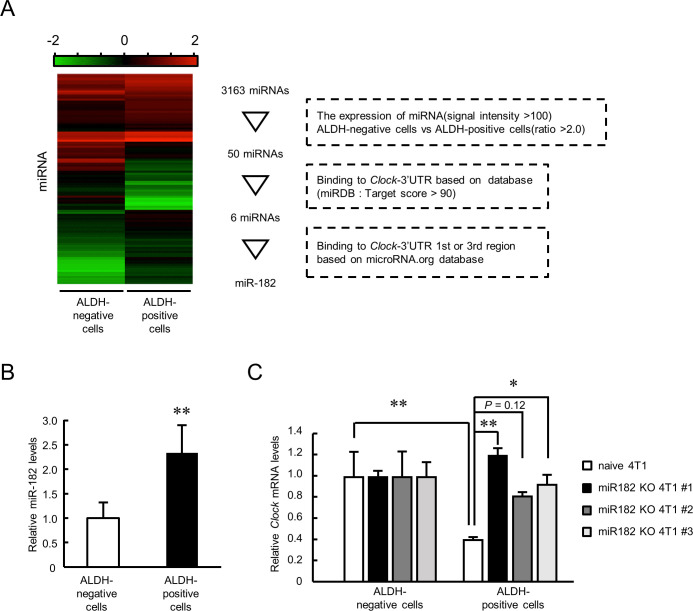
Figure 6. Role of miR-182 in post-transcriptional regulation of Clock gene expression in ALDH-positive 4T1 cells.

(A) Procedure of selecting miRNA that regulates Clock expression in ALDH-positive 4T1 cells. Heatmap shows the differential expression of miRNA between ALDH-negative and -positive 4T1 cells. microRNA target prediction databases (miRDB and microRNA.org) were applied to this selection. (B) The expression levels of mmu-miR-182 in ALDH-negative and -positive cells. Data were normalized by the β-Actin mRNA levels. Values are the mean with SD (n = 5). The value of ALDH-negative cells is set at 1.0. **p<0.01; significant difference from ALDH-negative cells (t8 = 3.828, Student’s t-test). (C) miR-182 negatively regulates the expression of Clock mRNA in ALDH-positive 4T1 cells. Three miR-182 KO clones were selected for this experiment. Data were normalized by the 18 s rRNA levels. Values are the mean with SD (n = 3). The values of ALDH-negative cells are set at 1.0. *p<0.05, **p<0.01; significant difference between two groups (F7,16 = 7.681, p<0.01, ANOVA with the Tukey–Kramer post hoc test).

Figure 6—source data 1. This spreadsheet contains the source for Figure 6.

Figure 6.

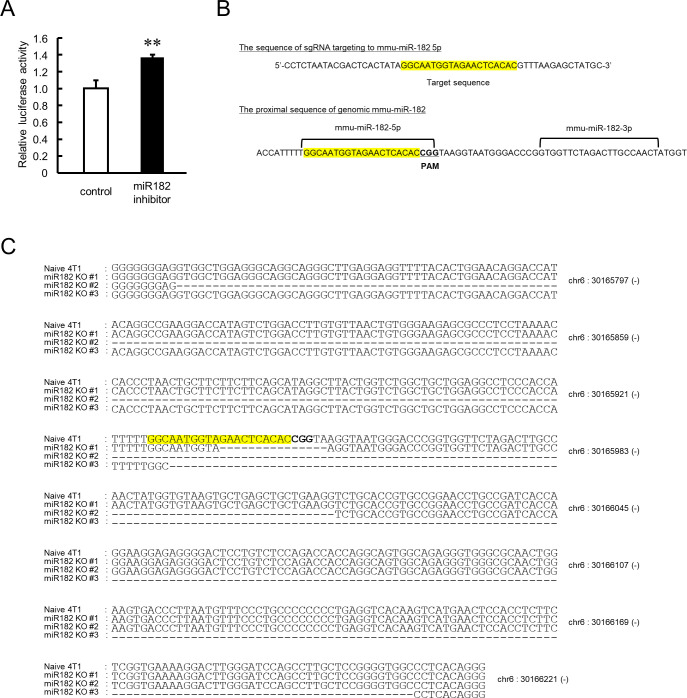
Figure 6—figure supplement 1. Influence of functional depletion of miR-182 on the regulation of Clock expression.

Figure 6—figure supplement 1.

(A) Influence of the miR-182::hairpin inhibitor on luciferase activity of Clock 3’UTR 1 st::Luc. Data were normalized by the renilla luciferase activity as an internal control. Values are the mean with SD (n = 3). The value of control group is set at 1.0. **p<0.01; significant difference between two groups (t4 = 7.569, p<0.01; Student’s t-test). (B) Scheme of the mmu-miR-182 target region. Yellow shaded areas indicate the sgRNA-targeted sequence. (C) Proximal genomic region around mmu-miR-182 in naive and miR-182 knockout (KO) 4T1 cells clone no. #1 to #3.
Figure 6—figure supplement 1—source data 1. This spreadsheet contains the source for Figure 6—figure supplement 1.
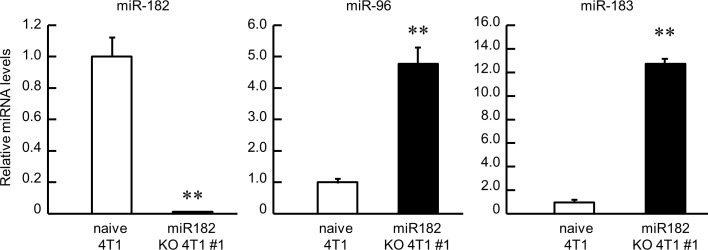
Figure 6—figure supplement 2. The influence of genomic depletion of miR-182 on the other clustered miRNAs.

Figure 6—figure supplement 2.

Data were normalized by 18 s rRNA levels. Values are the mean with SD (n = 3). The value of naive 4T1 cells is set at 1.0. **p<0.01; significant difference between two groups (t4 = 12.819 for miR182, t4 = 11.439 for miR96, t4 = 55.277 for miR183, Student’s t-test).
Figure 6—figure supplement 2—source data 1. This spreadsheet contains the source for Figure 6—figure supplement 2.