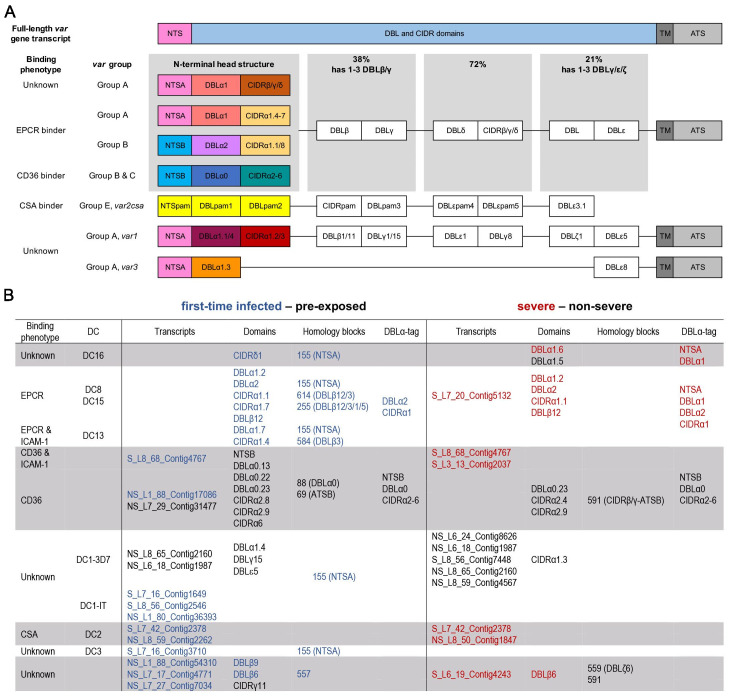
Figure 3. Summary of PfEMP1 transcripts, domains, and homology blocks that were found more or less frequently in malaria-naive and severely ill patients.
A schematic presentation of all var gene groups with their associated binding phenotypes and typical PfEMP1 domain compositions. The N-terminal head structure confers mutually exclusive receptor-binding phenotypes: EPCR (beige: CIDRα1.1/4–8), CD36 (turquoise: CIDRα2–6), CSA (yellow: VAR2CSA), and yet unknown phenotypes (brown: CIDRβ/γ/δ; dark red: CIDRα1.2/3 from VAR1, VAR3). Group A includes the conserved subfamilies VAR1 and VAR3, EPCR-binding variants, and those with unknown binding phenotypes conferred by CIDRβ/γ/δ domains. Group B PfEMP1 can have EPCR-binding capacities, but most variants share a four-domain structure, with group C-type variants capable of CD36 binding. Dual binders can be found within groups A and B, with a DBLβ domain after the first CIDR domain responsible for ICAM-1 (DBLβ1/3/5) or gC1qr binding (DBLβ12) (A). Transcripts, domains, and homology blocks according to Rask et al., 2010 as well as domain predictions from the DBLα-tag approach were found to be significantly differently expressed (p-value<0.05) between patient groups of both comparisons: first-time infected (blue) versus pre-exposed (black) cases and severe (red) versus non-severe (black) cases (B). ATS: acidic terminal sequence; CIDR: cysteine-rich interdomain region; CSA: chondroitin sulphate A; DBL: Duffy binding-like; DC: domain cassette; EPCR: endothelial protein C receptor; gC1qr: receptor for complement component C1q; ICAM-1: intercellular adhesion molecule 1; NTS: N-terminal segment; PAM: pregnancy-associated malaria; TM: transmembrane domain.


