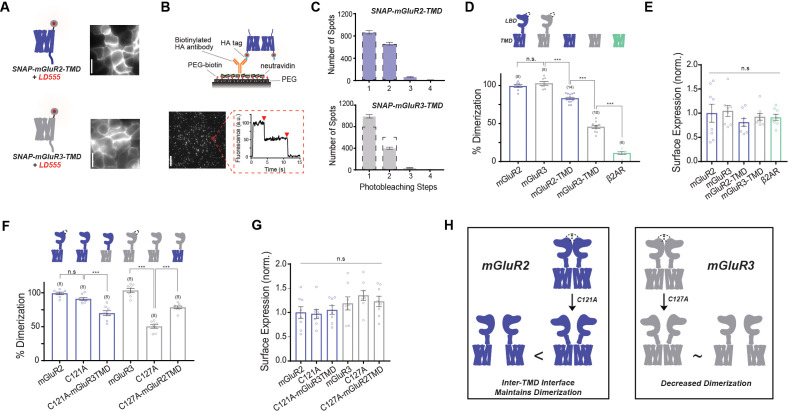
Figure 1. mGluR2 and mGluR3 transmembrane domains show different dimerization propensities in a single molecule pulldown assay.
(A) Left, cartoons of SNAP-mGluR2-TMD (top) and SNAP-mGluR3-TMD (bottom) labeled with fluorophore LD555. Right, representative images showing expression and surface labeling of SNAP-mGluR2-TMD (top) and SNAP-mGluR3-TMD (bottom) in HEK 293 T cells before lysis. (B) Top, schematic showing the SiMPull setup. Bottom, representative image of single molecules with representative fluorescence time course for an individual protein complex (red circle) demonstrating two-step photobleaching. Scale bar = 10 µm. (C) Histogram summarizing the photobleaching step distribution for SNAP-mGluR2-TMD (n = 1598 total spots from 14 movies) and SNAP-mGluR3-TMD (n = 1435 total spots from 10 movies). Dashed line on the SNAP-mGluR3-TMD plot shows the normalized photobleaching step distribution for SNAP-mGluR2-TMD for comparison. (D) Bar graph showing percent dimerization for SNAP-tagged constructs. * indicates statistical significance (one-way ANOVA, p=8.9E-30; Tukey-Kramer for mGluR2 vs. mGluR3 p=0.78, for mGluR3 vs. mGluR2-TMD p=6.9E-8, for mGluR2-TMD vs. mGluR3-TMD p=8.2E-13, for mGluR3-TMD vs. β2AR p=1.7E-12). (E) Bar graph showing surface expression for constructs in (D). Values are normalized to SNAP-mGluR2. Expression is not significantly different between constructs (one-way ANOVA, p=0.64). (F) Bar graph showing the percent dimerization for SNAP-tagged constructs. * indicates statistical significance (one-way ANOVA, p=2.1E-17; Tukey-Kramer for mGluR2 vs. mGluR2-C121A p=0.27, for mGluR2-C121A vs. mGluR2-C121A-mGluR3TMD p=2.5E-5, for mGluR3 vs. mGluR3-C127A p=1.1E-12, for mGluR3-C127A vs. mGluR3-C127A-mGluR2TMD p=4.1E-8). (G) Bar graph showing surface expression for constructs in (F). Values are normalized to SNAP-mGluR2. Expression is not significantly different between constructs (one-way ANOVA, p=0.12). (H) Schematic illustrating the effect of inter-TMD interactions in mGluR2 and mGluR3 dimer assembly. The '<' and '~' symbols refer to relative differences in dimerization propensity. Number of movies analyzed for each condition is shown in parenthesis above each bar. Error bars are s.e.m. Associated figure supplements include Figure 1—figure supplements 1–5.

