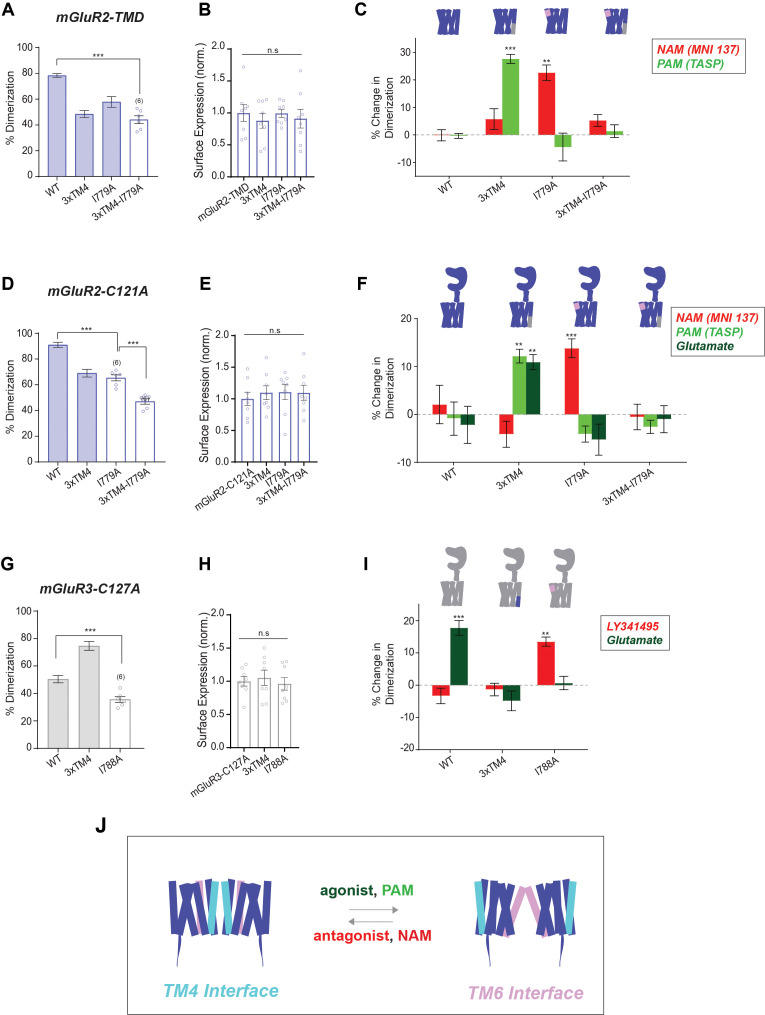
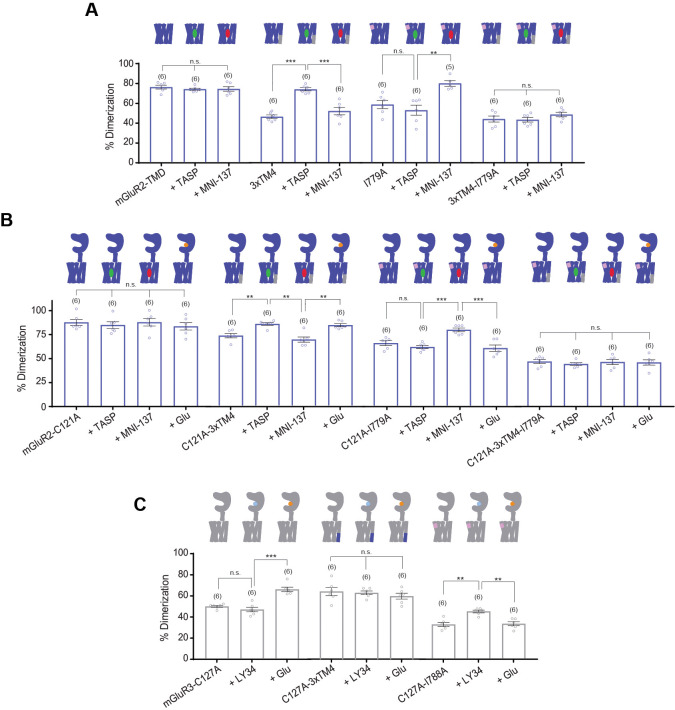
Figure 6. SiMPull analysis of ligand induced inter-TMD dimer rearrangement.
(A) Bar graph showing percent dimerization for SNAP-tagged constructs labeled with LD555. * indicates statistical significance (one-way ANOVA, p=3.9E-7; Tukey-Kramer for mGluR2-TMD vs. mGluR2-TMD-3xTM4-I779A p=5.1E-7). Shaded bars indicate data is repeated from Figures 2C and 5B. (B) Bar graph showing surface expression for constructs in (A). Values are normalized to SNAP-mGluR2-TMD. Expression is not significantly different between constructs (one-way ANOVA, p=0.86). (C) Bar graph showing the percent change in dimerization compared to no drug conditions for SNAP-tagged constructs labeled with LD555. * indicates statistical significance (one-way ANOVA, p=4.4E-16; Tukey-Kramer for mGluR2-TMD-3xTM4 vs. mGluR2-TMD-3xTM4 + TASP p=7.1E-6, for mGluR2-TMD-I779A vs. mGluR2-TMD-I779A + MNI 137 p=0.0036). (D) Bar graph showing percent dimerization for SNAP-tagged constructs labeled with LD555. * indicates statistical significance (one-way ANOVA, p=7.4E-11; Tukey-Kramer for mGluR2-C121A vs. mGluR2-C121A-I779A p=6.7E-7, for mGluR2-C121A-I779A vs. mGluR2-C121A-3xTM4-I779A p=0.00021). Shaded bars indicate data is repeated from Figures 1F and 2E. (E) Bar graph showing surface expression for constructs in (D). Values are normalized to SNAP-mGluR2-C121A. Expression is not significantly different between constructs (one-way ANOVA, p=0.89). (F) Bar graph showing the percent change in dimerization compared to no drug conditions for SNAP-tagged constructs labeled with LD555. * indicates statistical significance (one-way ANOVA, p=1.4E-31; Tukey-Kramer for mGluR2-C121A-3xTM4 vs. mGluR2-C121A-3xTM4 + TASP p=0.0029, for mGluR2-C121A-3xTM4 vs. mGluR2-C121A-3xTM4 + Glu p=0.0093, for mGluR2-C121A-I779A vs. mGluR2-C121A-I779A + MNI 137 p=0.036). (G) Bar graph showing percent dimerization for SNAP-tagged constructs labeled with LD555. * indicates statistical significance (one-way ANOVA, p=1.2E-7; Tukey-Kramer for mGluR3-C127A vs. mGluR3-C127A-I788A p=0.0033). Shaded bars indicate data is repeated from Figures 1F and 2G. (H) Bar graph showing surface expression for constructs in (G). Values are normalized to SNAP-mGluR3-C127A. Expression is not significantly different between constructs (one-way ANOVA, p=0.79). (I) Bar graph showing the percent change in dimerization compared to no drug conditions for SNAP-tagged constructs labeled with LD555. * indicates statistical significance (one-way ANOVA, p=1.5E-12; Tukey-Kramer for mGluR3-C127A vs. mGluR3-C127A + Glu p=9.8E-7, for mGluR3-C127A-I788A vs. mGluR3-C127A-I788A + LY34 p=0.011). The number of movies analyzed is shown in parentheses. Error bars represent s.e.m. (J) Schematic summarizing data indicating that TM4 mediates inactive interfaces which reorient to a TM6 interface upon activation by PAMs or agonists. Associated figure supplement includes Figure 6—figure supplement 1.


