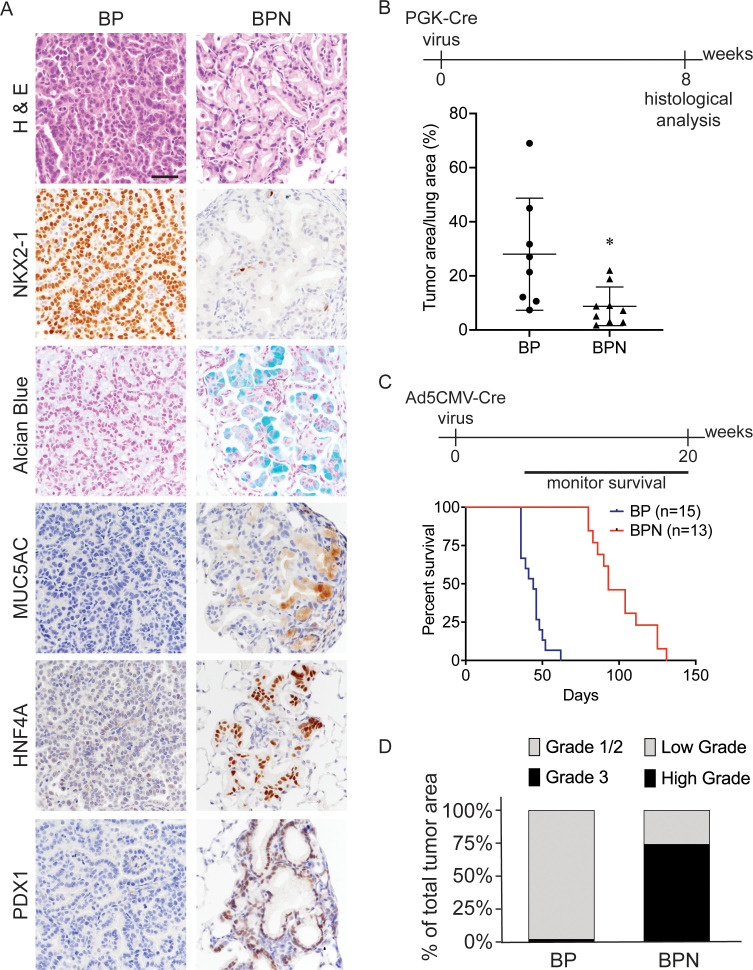
Figure 1. Nkx2-1 deletion induces mucinous adenocarcinoma but impairs tumor initiation in BRAFV600E-driven lung adenocarcinoma.
(A) Representative photomicrographs of lung neoplasia arising 8 weeks after initiation with PGK-Cre lentivirus (5 × 10³ pfu/mouse). BP mice are BrafLSL-V600E/+;Trp53f/f;Nkx2-1f/+;Rosa26LSL-tdTomato/LSL-tdTomato. BPN mice are BrafLSL-V600E/+;Trp53f/f;Nkx2-1f/f;Rosa26LSL-tdTomato/LSL-tdTomato. Hematoxylin and eosin (H and E), Alcian Blue stain for mucin production, and immunohistochemistry (IHC) for NKX2-1, plus, markers of gastrointestinal differentiation. Scale bar: 100 µm. (B) Quantitation of lung tumor burden 8 weeks after initiation with PGK-Cre lentivirus (5 × 10³ pfu/mouse) in indicated genotypes of mice: BP (n = 8), BPN (n = 9). *p=0.019 by Student’s t-test. (C) Long-term survival after tumor initiation with Ad5-CMV-Cre adenovirus (2.5 × 10⁷ pfu/mouse) in mice of indicated genotypes. p<0.0001 by Log-rank test. (D) Histopathologic assessment of the percentage of tumors of indicated grade for mice enrolled in survival study (C).
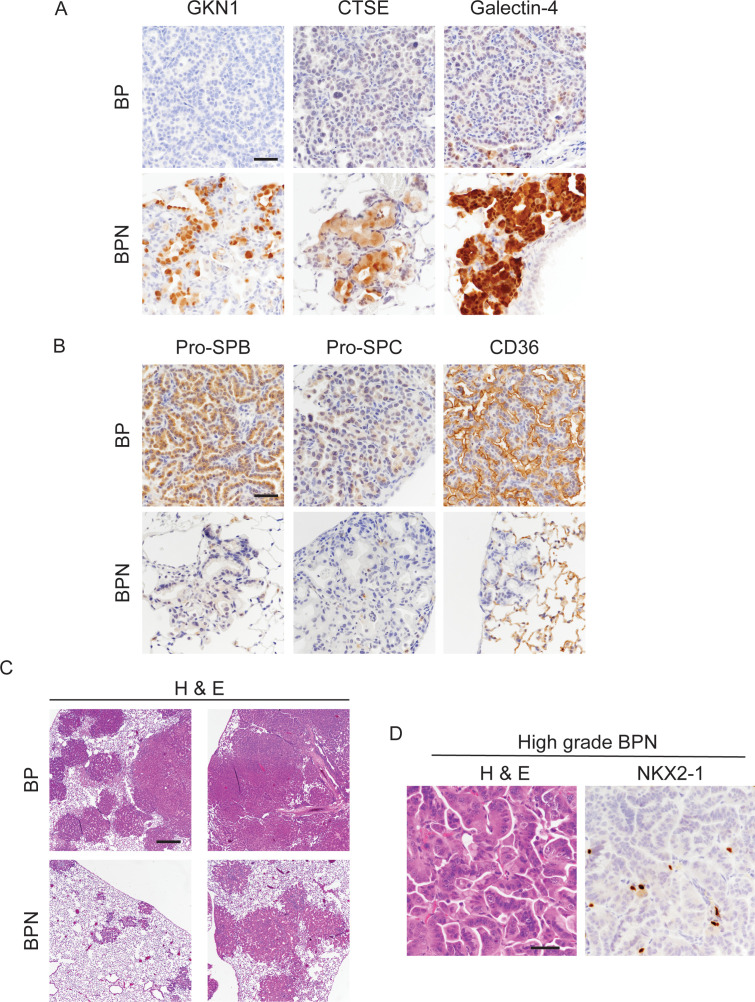
Figure 1—figure supplement 1. Nkx2-1 deletion induces mucinous adenocarcinoma but impairs tumor initiation in BRAFV600E-driven lung adenocarcinoma.
Figure 1—figure supplement 2. Percentage of incomplete recombinant tumors in BrafLSL-V600E/+;Trp53f/f;Nkx2-1f/f;Rosa26LSL-tdTomato/LSL-tdTomato mice from Figure 1C.


