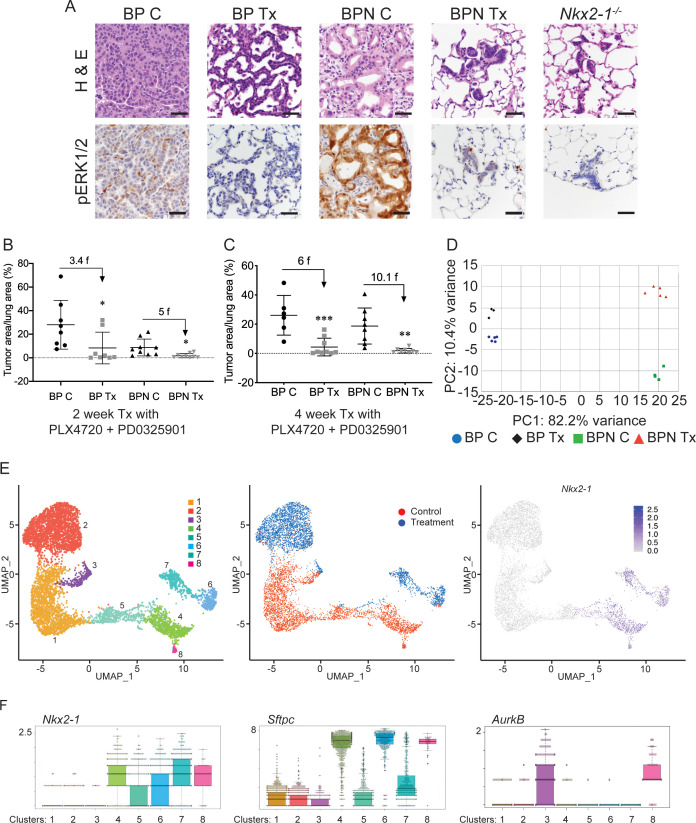
Figure 4. NKX2-1 status modulates response to MAPK pathway inhibitors.
(A) Representative H and E and phospho-ERK1/2 immunostaining photomicrographs of paraffin-embedded lung sections from BrafLSL-V600E/+;Trp53f/f;Nkx2-1f/+;Rosa26LSL-tdTomato/LSL-tdTomato and BrafLSL-V600E/+;Trp53f/f;Nkx2-1f/f;Rosa26LSL-tdTomato/LSL-tdTomato mice that were treated with control chow (BP C/BPN C) or chow containing PLX4720 (200 mg/kg) and PD0325901 (7 mg/kg) inhibitors (BP Tx/BPN Tx) for 2 weeks starting at 6 weeks post-tumor initiation with PGK-Cre lentivirus (5 × 10³ pfu/mouse). Scale bar: 100 µm. (B, C) Quantitation of tumor burden in BP and BPN mice that were fed control chow or chow containing MAPK inhibitors starting at 6 weeks post-tumor initiation with PGK-Cre lentivirus (5 × 10³ pfu/mouse). Graphs represent mean ± S.D. (B) Chow treatment lasted 2 weeks and lungs were harvested at the 8-week timepoint. BP C (n = 8), BP Tx (n = 8), BPN C (n = 9), BPN Tx (n = 9). *p<0.05 by Student’s t-test. Numbers indicated above graphs represent the fold reduction in tumor burden upon inhibitor-chow administration. (C) Chow treatment lasted 4 weeks and lungs were harvested at the 10-week timepoint. BP C (n = 6), BP Tx (n = 9), BPN C (n = 8), BPN Tx (n = 8). **p<0.01, ***p<0.001 by Student’s t-test. Numbers indicated above graphs represent the fold reduction in tumor burden with inhibitor-chow administration. (D) Global gene expression analyses were performed on RNAs from FACS-sorted tdTomato+ BP C (n = 5), BP Tx (n = 3), BPN C (n = 4), and BPN Tx (n = 5) murine lung tumor cells isolated at 7 weeks following initiation with Ad5-Spc-Cre adenovirus (5 × 10⁸ pfu/mouse for BP and 8 × 10⁸ pfu/mouse for BPN mice). Control and MAPK-inhibitor chow treatments were given for 1 week at 6 weeks post-adenoviral instillation. Shown is the principal-component analysis (PCA) plot of the top 500 most variable genes showing that the four experimental groups of lung tumors, BP C, BP Tx, BPN C, and BPN Tx, had distinct global patterns of gene expression. (E) UMAP plots showing relatedness of high-quality, tumor cell scRNA-seq profiles from BPN control (n = 2) and BPN MAPKi-treated (n = 2) mice. Tumor cluster designations are indicated (left). Control and treated cells indicated (middle). Nkx2-1 expression in scRNA-seq data indicating that clusters 4–8 represent incomplete recombinants (right). Single tumor cells were obtained by FACS-sorting tdTomato+ cells isolated at 7 weeks following initiation with Ad5-Spc-Cre adenovirus (8 × 10⁸ pfu/mouse). Control and MAPK-inhibitor chow treatments were given for 1 week at 6 weeks post- adenoviral instillation. (F) Beeswarm plots of single cell sequencing data showing expression levels of Nkx2-1, Sftpc and Aurkb transcripts in tumor clusters 1–8.


