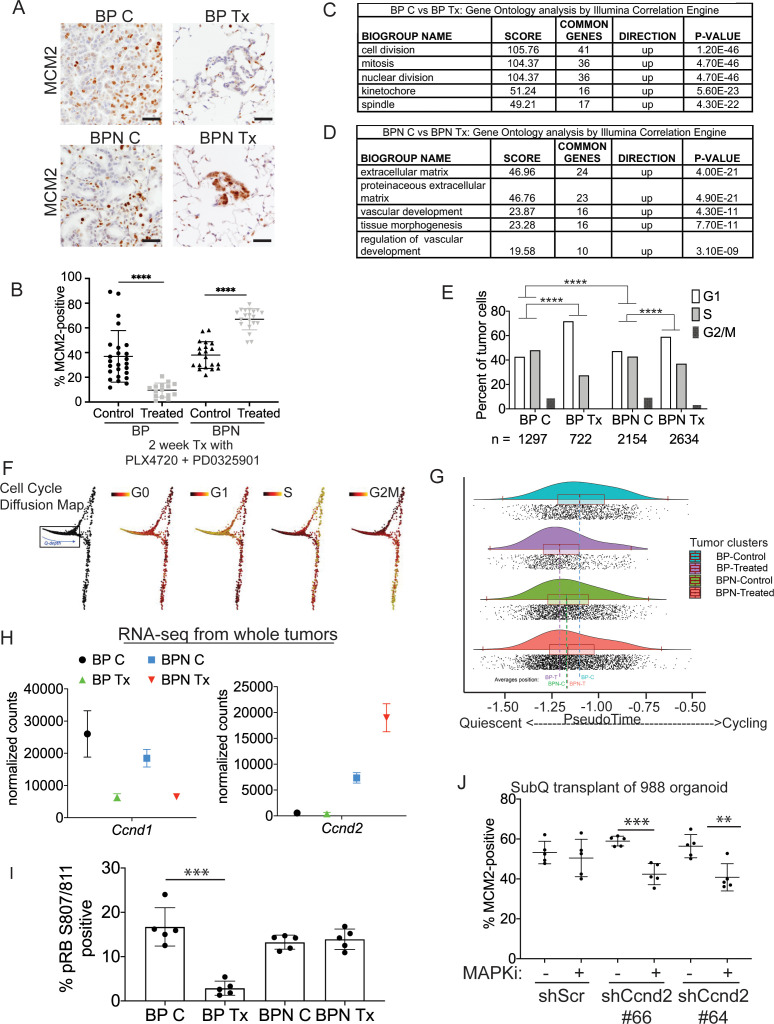
Figure 5. Differential impact of MAPK inhibitors on the cell cycle in NKX2-1-positive and NKX2-1-negative tumors.
(A, B) Immunostaining for and quantitation of the proliferation marker MCM2 in tumors from BP and BPN mice at 8 weeks post-initiation. Control or MAPK-inhibitor infused chow feeding started at 6 weeks and was maintained for 2 weeks. BP C (25 tumors from four mice), BP Tx (15 tumors from three mice), BPN C (20 tumors from three mice), BPN Tx (20 tumors from three mice). Scale bar: 100 µm. Graphs represent mean ± S.D. ****p<0.0001 by Student’s t-test. (C, D) Lists of the top-scoring Gene Ontology pathway terms of differentially expressed genes between control- and MAPKi drug-chow-treated BP (C) or BPN (D) tumors, as determined by Illumina Correlation Engine analyses of whole-tumor RNA-seq data. UP = enriched in control relative to treated samples. (E) Analysis of cell cycle score in single-cell RNA sequencing data using Seurat package. Utilized cell cycle genes as defined by Mizuno et al., 2009. ****p<0.0001 by Wilcox test. BP C = clusters 4, 5, 8; BP Tx = clusters 6, 7; BPN C = clusters 1, 3control; BPN Tx = clusters 2, 3treated (see Figure 4E). (F) Diffusion map of cell cycle phase signatures in scRNA-seq data showing coherent enrichment for phase specific signatures at specific graphical regions. > 80% of cells are disturbed in the box that correlates with G0 and G1 signatures and along which we fit a principle curve to model likely depth of quiescence (Q-depth). (G) Positioning of scRNA-seq profiles from the indicated cell clusters along the Q-depth curve. BPN control = cluster 1; BPN treated = cluster 2; BP control = cluster 4+5; BP treated = cluster 6+7. (H) Graph comparing absolute expression levels of Ccnd1 and Ccnd2, data obtained from RNA sequencing of whole tumors. (I) Quantitation of phospho-RB-positive tumor cells in the indicated tumor types at 8 weeks post-initiation. Control or MAPK-inhibitor chow feeding started at 6 weeks and was maintained for 2 weeks. Graphs represent mean ± S.D. Multiple lesions per mouse, for five mice in each cohort, were analyzed. ***p<0.001 by Student’s t-test. (J) Effect of knocking down CyclinD2 on MCM2 marker expression. A BPN organoid line was stably transduced with control or Ccnd2-targeting shRNA constructs followed by subcutaneous transplantation and MAPK-inhibitor chow treatment after 8 weeks of growth. Subcutaneous tumors were harvested after 1 month of drug treatment. MCM2 quantitation was confined to glandular structures that most closely resemble autochthonous BPN tumors. Graphs are mean ± S.D. ***p<0.001, **p<0.01 by Student’s t-test. N = 5 mice per cohort.


