. 2021 Apr 6;10:e66788. doi: 10.7554/eLife.66788

Figure 7. MAPK inhibition activates WNT signaling in NKX2-1-negative tumors.

(A) Transcriptome analysis of genes comprising the canonical WNT pathway gene ontology (AmiGO) in RNA purified from FACS-sorted BPN tumor cells 1 week post- treatment with PLX4720+PD0325901 or control chow. adjP <0.05 for each comparison. Color key indicates normalized expression levels (Log10). (B) Analysis of WNT pathway activity in scRNA-seq data using a WNT activation signature. BP indicates cells from clusters 4–8; BPN indicates cells from clusters 1–3 (see Figure 4E, F). C : control, Tx = drug treatment. (C) Kinetics of WNT signaling induction following MAPK-inhibitor treatment as indicated by qRT-PCR analysis of the canonical WNT signaling markers, Axin2 and Lgr5, on RNA isolated from drug/DMSO treated organoids for the indicated times. Data are mean ± S.D. A representative experiment of three is shown. ****p<0.0001, ***p<0.001, **p<0.01, *p<0.05 by Student’s t-test. (D, E) WNT-low cells can give rise to WNT-high cells. BPN organoid lines, 988 shown here, were stably transduced with a WNT-reporter construct (7TGP, Addgene Plasmid #24305) and FACS-sorted to isolate cells with undetectable WNT activity (pink gate) (D). (E) Dynamics of sorted WNT-low cells when cultured in WNT rich spheroid media (50% LWRN vs. 5% LWRN) or in the presence of MEK-inhibitor. Numbers shown are the percentage of live tdTomato+GFP+ cells in each culture as quantified by flow cytometry (FlowJo). Data shown is a representative of two independent sorting experiments.

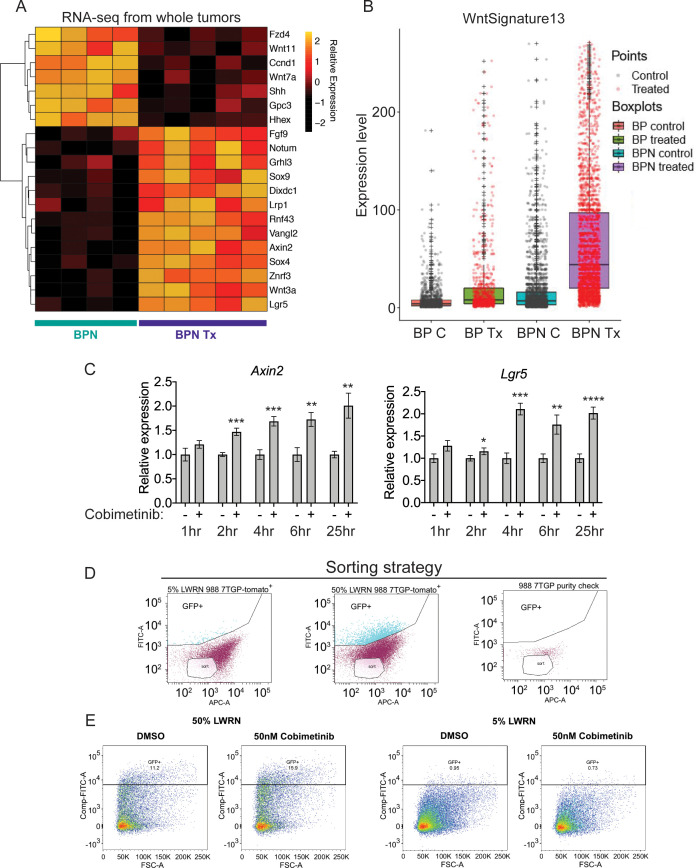
Figure 7.

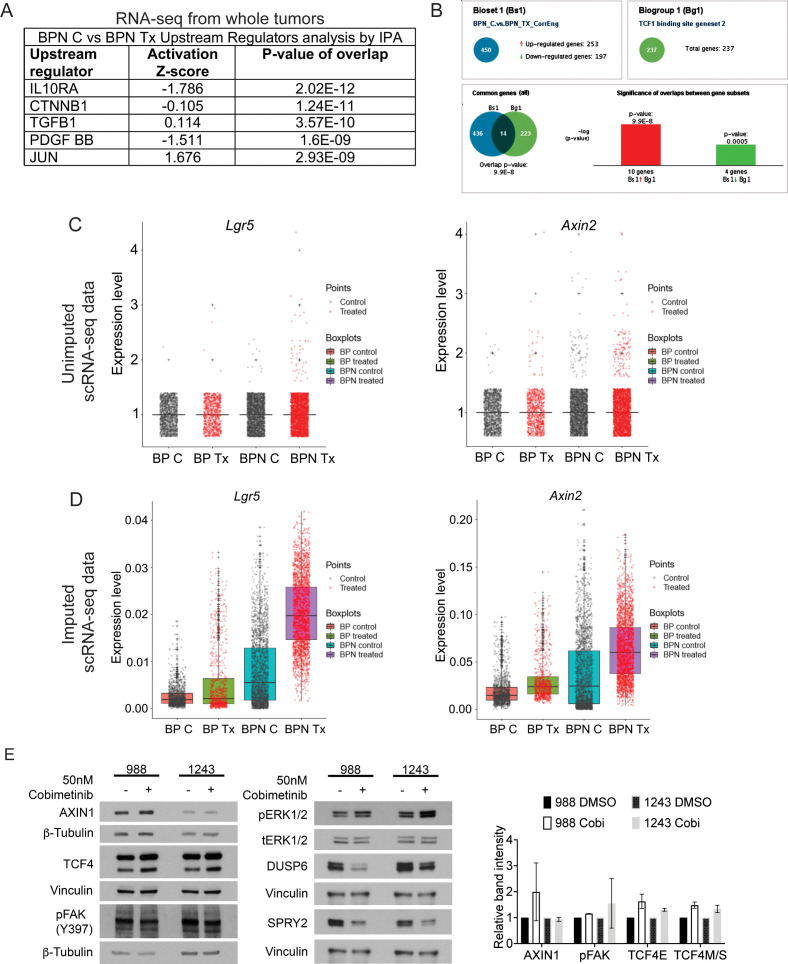
Figure 7—figure supplement 1. MAPK inhibition activates WNT signaling in NKX2-1-negative tumors.

Figure 7—figure supplement 1.

(A) List of the top-scoring genes in IPA Upstream Regulator analysis when comparing differentially expressed genes between control- and BRAFi/MEKi-chow treated BPN tumors in whole-tumor RNA sequencing data. (B) Regulator Motif analysis by Illumina Correlation Engine identifies significant differences in TCF1 binding site genesets between control and treated BPN tumors. (C, D) Plots of normalized raw and imputed expression values for Lgr5 and Axin2 transcripts in scRNA-seq data as readouts of canonical WNT activation levels in indicated clusters. (E) Candidate mechanisms by which a cross-talk between ERK and WNT pathways can occur as evaluated by immunoblotting. Representative western blot image and quantitation of band intensity (ImageJ) from two independent experiments is provided. None of the changes in protein abundance between control and drug-treated (24 hr) organoid samples are statistically significant. Graphs indicate mean ± S.D.
Figure 7—figure supplement 2. Multiple sources for WNT ligands in BRAFV600E-driven lung adenocarcinoma.

Figure 7—figure supplement 2.

Relative expression values for all Wnt genes in tumor and stromal cells from BP and BPN tumors profiled by scRNA-seq. Values were derived as follows: first, raw gene expression values in each cluster were logged. Then, the average value of each cluster was divided by the maximum value to calculate relative expression. Cluster ID labels correspond to nomenclature used in Figure 4—figure supplement 1E.