. 2021 Apr 6;10:e66788. doi: 10.7554/eLife.66788

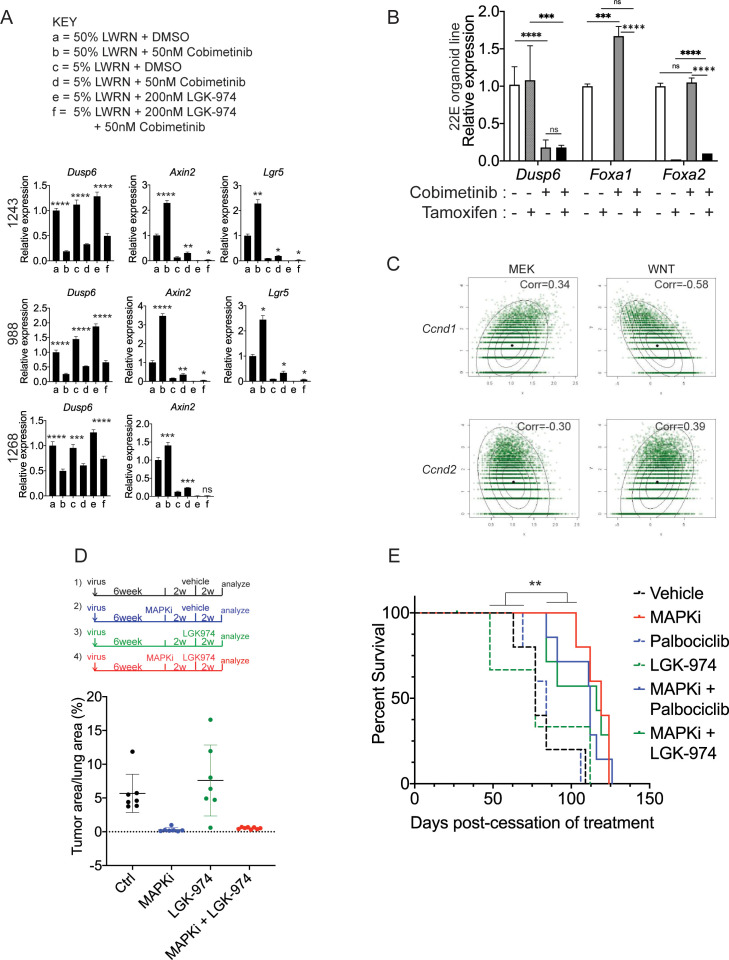
Figure 8. WNT signaling and the transcription factors FoxA1/FoxA2 are partially required for lineage switching induced by MAPK inhibition.

(A) Analyses of indicated gene expression levels in BPN (1243 and 988) and KPN (1268) tumor organoid lines by qRT-PCR at 24 hr and under different treatment conditions. Organoids were cultured in 50% L-WRN (a, b) or reduced 5% L-WRN media (c, d, e, f) and treated with DMSO (a, c), single agent Cobimetinib (b, d) or the Porcupine inhibitor, LGK-974 (e), and both inhibitors (f). Graphs indicate mean ± S.D. [p values are for a-b; c-d; or e-f comparisons]. Experiment was reproducibly performed three times. (B) qRT-PCR analysis of the expression levels of indicated cell identity markers in the 22E organoid line under four different conditions. 22E (derived from a lung tumor in a KrasFSF-G12D/+;Trp53frt/fr+;Foxa1f/f; Foxa2f/f;Rosa26FSF-CreERT2/FSF-CreERT2 mouse) lacks NKX2-1 expression and harbors conditional alleles of Foxa1 and Foxa2. Tamoxifen treatment induces CreERT2-mediated Foxa1/Foxa2 deletion. Data are mean ± S.D and a pool of two independent experiments. (C) Quantitation of the proliferation marker MCM2 in 10 week autochthonous BPN lung tumors under four different treatment conditions: (1) control (n = 7); (2) MAPK-inhibitor chow (n = 7); (3) LGK-974 (n = 7); and (4) MAPK-inhibitor chow and LGK-974 (n = 8). (D, E) Abundance of MCM2 or phospho-RB-positive cells in 10-week autochthonous lung tumors from BPN mice under the indicated conditions. Vehicle or drug treatments were administered at 6 weeks post tumor initiation for 4 weeks. Multiple tumors from n = 3 mice/group were quantitated. (A – E) ****p<0.0001, ***p<0.001, **p<0.01, *p<0.05, ns = not significant by Student’s t-test. (F) Graphical depiction of the molecular and pharmacological regulation of differentiation programs in LUAD (BioRender). Here, we investigated genotype-specific drug response. Cancer therapy triggers two alternative fates in drug-treated tumors of both genotypes: either regression or survival in a drug tolerant state. Molecularly, the drug tolerant state appears distinct in BP versus BPN tumors and can be exploited pharmacologically by targeting the cell cycle and/or drug-induced signaling pathways.

Figure 8.

Figure 8—figure supplement 1. WNT signaling and the transcription factors FoxA1/FoxA2 are partially required for lineage switching induced by MAPK inhibition.

Figure 8—figure supplement 1.

(A) Analyses of indicated gene expression levels in BPN (1243 and 988) and KPN (1268) tumor organoid lines by qRT-PCR at 24 hr and under different treatment conditions. Organoids were cultured in 50% L-WRN (a, b) or reduced 5% L-WRN media (c, d, e, f) and treated with DMSO (a, c), single agent Cobimetinib (b, d) or the Porcupine inhibitor, LGK-974 (e), and both inhibitors (f). Graphs indicate mean±S.D. ****p<0.0001, ***p<0.001, **p<0.01, *p<0.05, ns = not significant by Student’s t-test. [p values are for a-b; c-d; or e-f comparisons]. Experiment was reproducibly performed three times. (B) qRT-PCR analysis of indicated gene expression in 22E organoid line under MEK inhibition (Cobimetinib) and/or tamoxifen induced Foxa1 and Foxa2 deletion. Data are mean ± S.D and a representative of two independent experiments. ****p<0.0001, ***p<0.001, ns = not significant by Student’s t-test. (C) Density plots and correlation values for a MEK activation signature (x-axis left two panels) and a WNT signature (x-axis right two panels) versus Ccnd1 and Ccnd2 transcript levels as indicated based on scRNA-seq. (D) Quantitation of lung tumor burden 10 weeks post-initiation in BPN mice under four different treatment conditions: (1) control (n = 7); (2) MAPK-inhibitor chow (n = 7); (3) LGK-974 (n = 7); and (4) MAPK-inhibitor chow and LGK-974 (n = 8). (E) Overall survival of BPN tumor bearing mice that were enrolled in six different treatment conditions for 4 weeks. Vehicle (n = 5), MAPK-inhibitor chow (n = 5), Palbociclib (n = 5), LGK-974 (n = 4); MAPK-inhibitor chow + Palbociclib (n = 7), and MAPK-inhibitor chow + LGK-974 (n = 7). **p=0.0017 by Log-rank test.
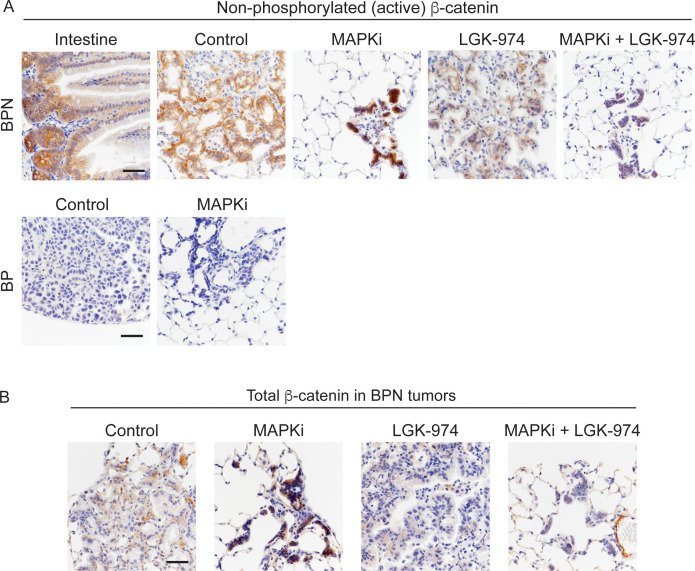
Figure 8—figure supplement 2. Characterization of MAPK inhibitor-driven signaling changes.

Figure 8—figure supplement 2.

(A, B) Active (unphosphorylated on T41, S37, S33 residues) and total β-catenin staining in tumors under indicated treatment conditions. For BPN tumors, see Figure 8C for experimental details. BP tumors are 8-week autochthonous lung tumors from mice that received control or MAPK-inhibitor chow for 2 weeks (See Figure 1A for more experimental details). Small intestine: positive control for detection of active β-catenin. Scale bar: 100 µm.