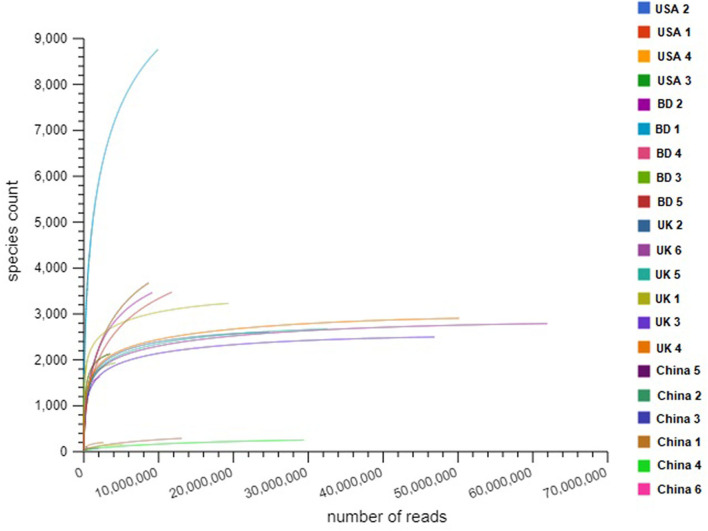
Fig. S1.
Differences in species richness in COVID-19 (BD and China), and non-COVID (UK and USA) disease metagenomes. Rarefaction curves showing the influence of sequencing depth (number of reads per sample, X axis) on species richness (Y axis) in COVID-19 and non-COVID samples. The rarefaction curves representing the number of species per sample indicated that the sequencing depth was sufficient enough to fully capture the microbial diversity as existed.

