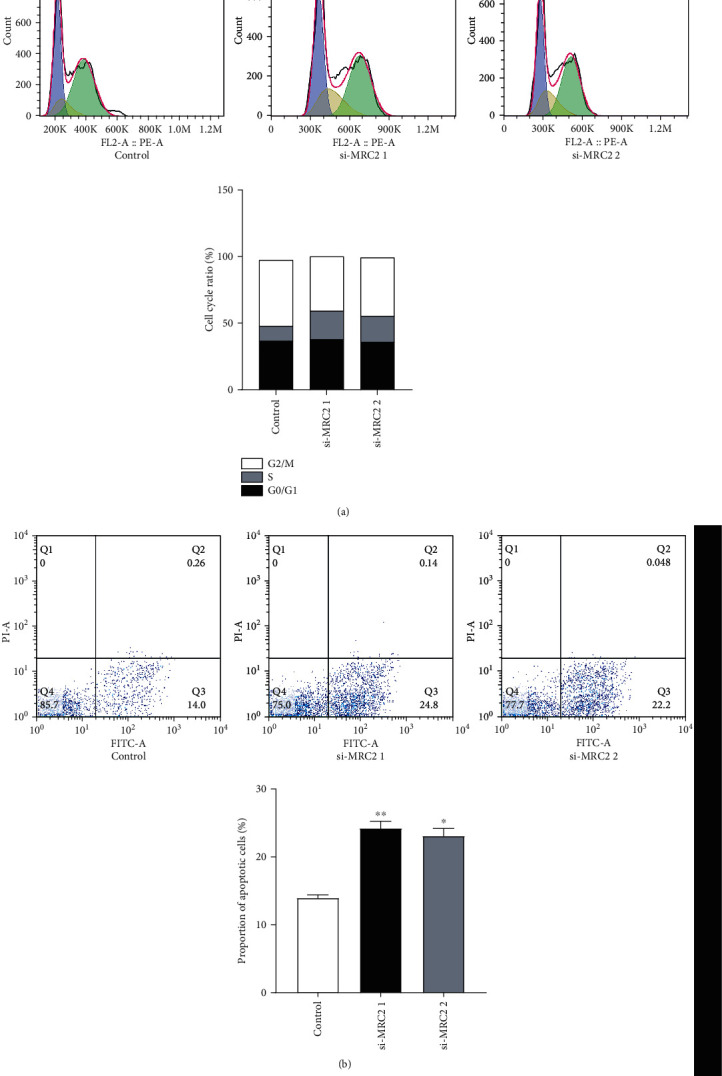
Figure 4.

The cell cycle was analyzed using flow cytometry. Compared with the negative control group, the proportion of cells in the S phase in the experimental group increased, the ratio of the cells in the G0/G1 phase remained unchanged, and the ratio of cells in the G2/M phase decreased (a). The number of apoptotic cells was analyzed using flow cytometry. The proportion of apoptotic cells increased after knockdown of MRC2. The experiment was repeated three times (b). ∗P < 0.05 vs. control group.
