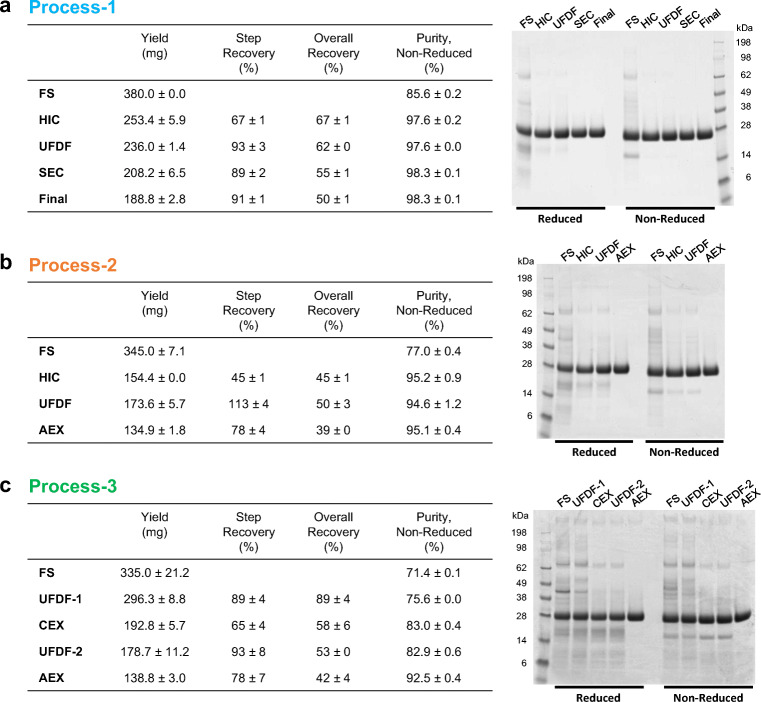
Fig. 3.
In-process sample comparison from three processes. Yield, step recovery, overall recovery, and purity are shown as an average ± SD calculated from two independent gels that are shown in the table (left) and a representative gel stained with Coomassie blue that is shown (right) from process 1 (a), process 2 (b), and process 3 (c). FS, fermentation supernatant; HIC, hydrophobic interaction chromatography; UFDF, ultrafiltration and diafiltration; SEC, size exclusion chromatography; AEX, anion exchange chromatography; CEX, cation exchange chromatography

