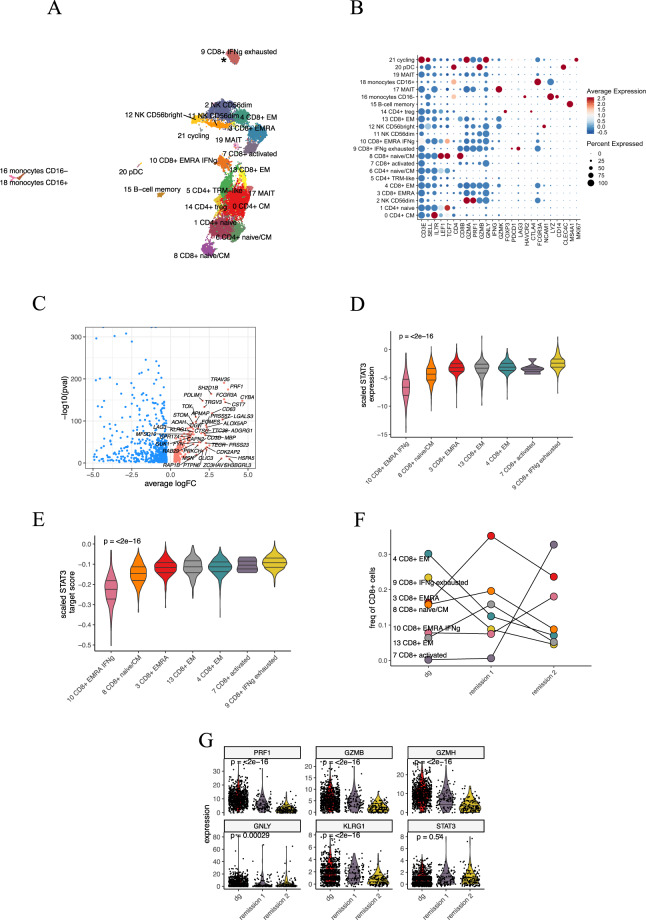
Fig. 5. AA-4 scRNA + TCRab-seq analysis.
A Two-dimensional UMAP projection of the transcriptomes of CD45+ lymphocyte cells pooled from three time points from peripheral blood. A total of 24,000 cells are annotated in 21 distinct clusters, 7 of which can be annotated as CD8+ T cells. *STAT3 mutated T-cell cluster. B Dot plot showing the canonical markers used to annotate the clusters. C Volcano plot showing differentially expressed genes between the TCRBV05-01 associated cluster (to the right, significant shown in red) against other CD8+ clusters (to the left, significant shown in blue). D Violin plot showing the scaled STAT3 expression in CD8+ clusters at diagnosis. E Violin plot showing the score of genes having at least one occurence of the transcription factor binding site within 4 kb of STAT3 binding site at diagnosis. F The relative abundances of CD8+ clusters during treatment. G Violin plot showing the significantly downregulated cytotoxic genes (PRF1, GZMB, GZMH, GNLY, LYZ) and stable STAT3 expression in the TCRBV05-01 associated cluster.

