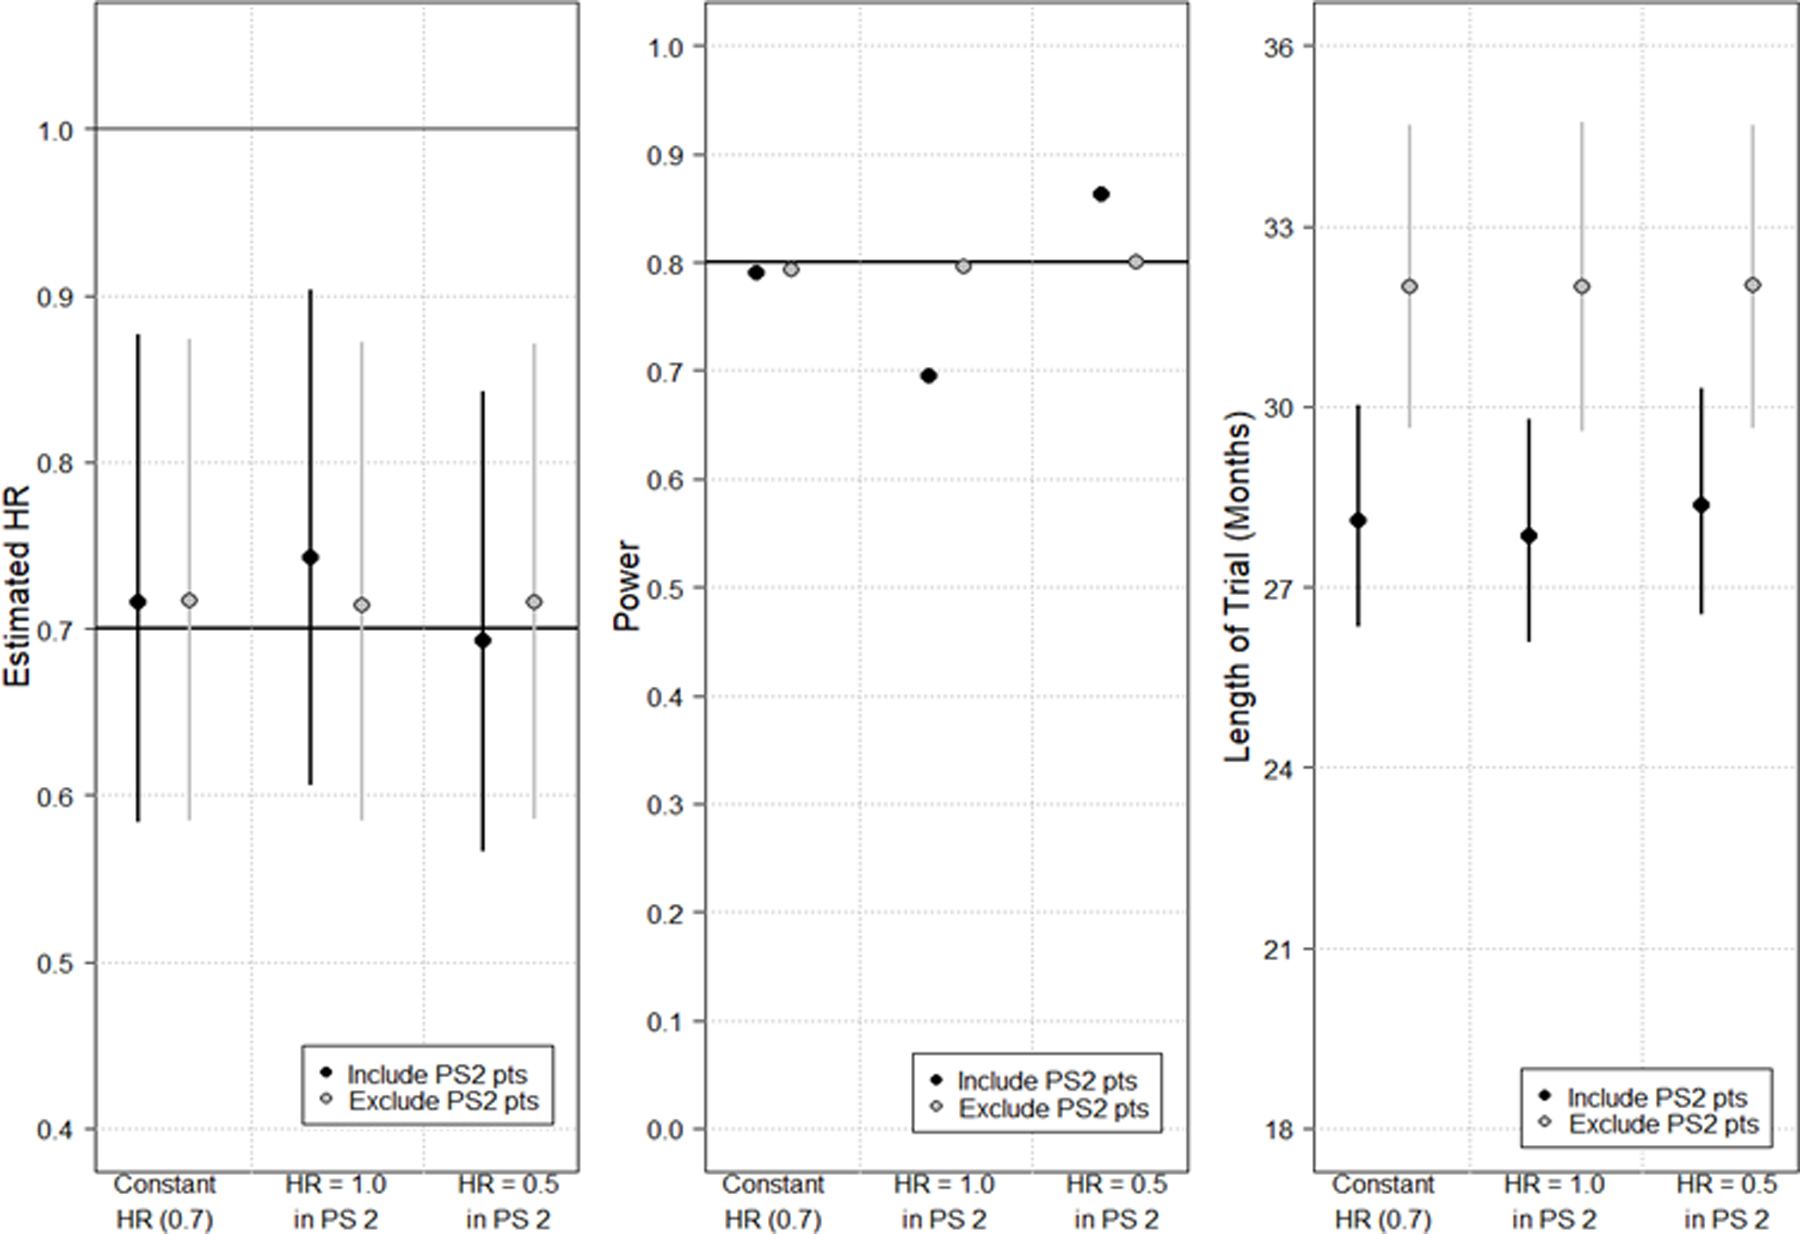
Figure 1.

Simulation study results depicting changes in estimated hazard ratio (HR) (Panel A); power (Panel B); and length of trial from first accrual to last required event for analysis (Panel C). Within each panel, six analyses are depicted. In panels A and C, the median from the simulations is plotted as a circle with lines extending vertically to the 5th and 95th percentiles. For each analysis, the HR of PS0 and PS1 patients remains constant at 0.7 and the HR of PS2 patients is varied. Red points/lines depict results when PS2 patients are included in the final analysis (N=500); blue points/lines depict results when PS2 patients are excluded (N=450). Regardless of sample size, the trial end is assumed to be when the required number of events (283 events) have been accrued per the power calculation.
