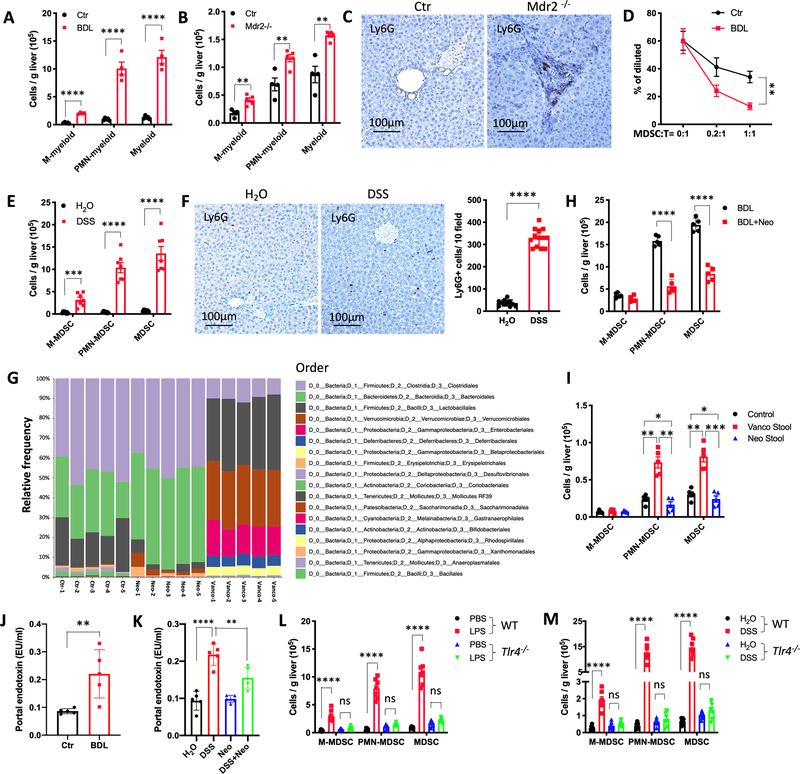
Figure 2.
LPS/TLR4 induces MDSC accumulation in the liver.
(A) Two weeks after BDL, the absolute number of hepatic M-myeloid, PMN-myeloid and total myeloid were determined in BDL and control (Ctr) mice. n=4 for Ctr and BDL. Data represent mean ± SEM. **** p<0.0001, two-way ANOVA.
(B) The absolute numbers of hepatic M-myeloid, PMN-myeloid and total myeloid were determined in FVBN/J control (Ctr) and Mdr2−/− mice at the age of 10 week. n=4 for Ctr, 5 for Mdr2-/−. Data represent mean ± SEM. ** p<0.01, two-way ANOVA.
(C) Immunochemistry of Ly6G in liver of Ctr or Mdr2−/− mice at the age of 10 week.
(D) Inhibition of T cell proliferation by myeloid cells was assessed by flow cytometry of T cells in co-culture experiments. Hepatic CD11b+Gr-1+ myeloid cells were purified from control (Ctr) or BDL mice. Splenic T cells (T) were isolated from normal C57BL/6 mice. T cells were labeled with CFSE and activated using anti-CD3ε/ anti-CD28. Myeloid cells and T cells were co-cultured at different ratios. The percentage of diluted CFSE after 72 hours co-culture was measured by FACS. Data represent mean ± SEM. ** p<0.01, two-way ANOVA.
(E) The absolute numbers of hepatic M-MDSC, PMN-MDSC and total MDSC were determined in C57BL/6 mice after 1 cycle of DSS treatment (2.5% DSS in drinking water for 1 week, followed by regular water for 2 weeks). n=6 for H2O, 7 for DSS. Data represent mean ± SEM. **** p<0.0001, two-way ANOVA.
(F) Immunochemistry of Ly6G in H2O or DSS treated liver tissues. Ly6G+ cells in each field were counted by a blinded investigator. n=11 for H2O, 13 for DSS. Data represent mean ± SEM. **** p<0.0001, Student’s t test.
(G) C57BL/6 mice were treated with H2O (Ctr), Vancomycin (Vanco), or Neomycin for 3 weeks before stool samples were collected for 16s rRNA sequencing. n=5 for Ctr and BDL. Bar plots of the order levels in BDL and Ctr mice are shown. Relative abundance is plotted for each mouse.
(H) C57BL/6 mice received Neomycin for 2 weeks prior to BDL (BDL+Neo). Two weeks after BDL, the absolute numbers of hepatic M-MDSC, PMN-MDSC and MDSC were determined. n=5 for BDL and BDL+Neo. Data represent mean ± SEM. **** p<0.0001, two-way ANOVA.
(I) C57BL/6 germ free mice were colonized with stool samples from mice treated with vancomycin (Vanco Stool) or neomycin (Neo Stool) for 3 weeks by oral gavage. Two weeks later, mice were sacrificed and the absolute numbers of hepatic M-MDSC, PMN-MDSC and MDSC were determined. n=5 for Control, Vanco stool, and Neo stool. Data represent mean ± SEM. *p<0.05, **p<0.01, ***p<0.001, two-way ANOVA.
(J) Bile duct ligation (BDL) was performed in C57BL/6 mice. Two weeks later, the concentration of endotoxin in portal vein was detected. n=5 for Ctr and BDL. Data represent mean ± SEM. **p<0.01, Student’s t test.
(K) C57BL/6 mice received H2O, DSS, Neo, and DSS+Neo for 7 days. The concentration of endotoxin in portal vein was detected. n=5 for H2O, DSS, Neo, and DSS+Neo. Data represent mean ± SEM. **p<0.01, ***p<0.001, one-way ANOVA.
(L) PBS or 2.5mg/kg LPS was i.p. injected in Tlr4−/− or C57BL/6 wildtype (WT) mice. Three days later, the absolute numbers of M-MDSC, PMN-MDSC and total MDSC were determined. Data represent mean ± SEM. n=6 for PBS and 7 for LPS in WT mice, n=6 for PBS and LPS in Tlr4−/− mice. ns, no significant. ****p<0.0001, two-way ANOVA.
(M) WT or Tlr4−/− C57BL/6 mice were treated with H2O or 2.5 % DSS for 1 cycle. The absolute numbers of M-MDSC, PMN-MDSC and total MDSC were determined. Data represent mean ± SEM. n=7 for H2O and DSS in WT mice, n=7 for PBS and 8 for LPS in Tlr4−/− mice. ns, no significant. ****p<0.0001, two-way ANOVA.

