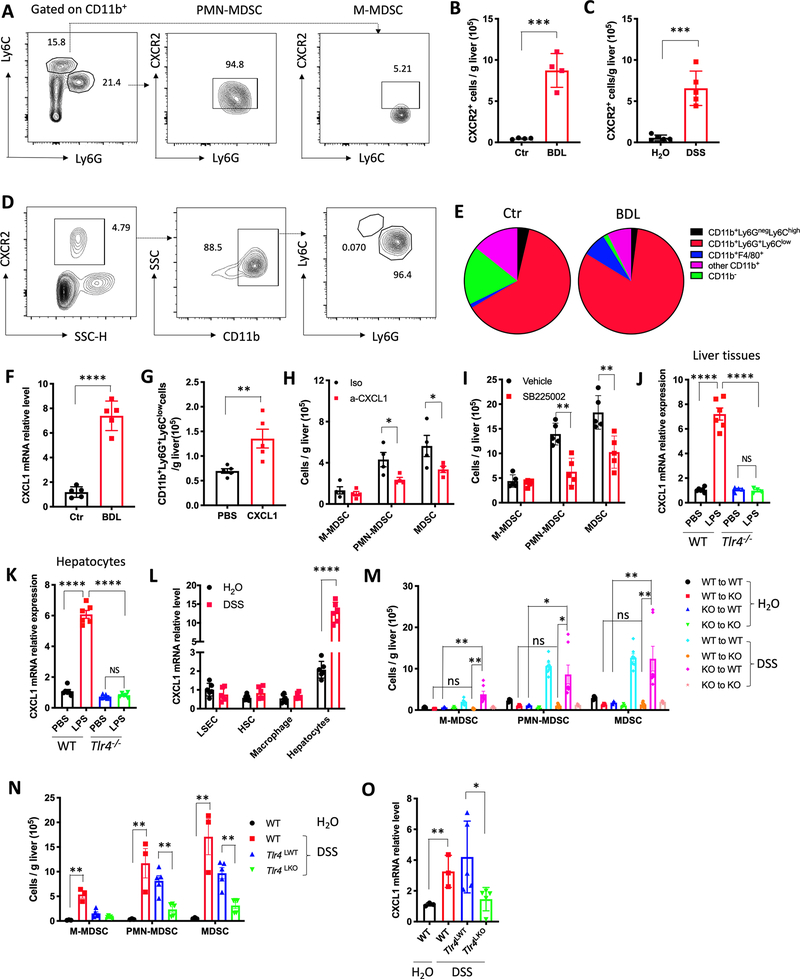
Figure 3.
Hepatocytes mediate MDSC accumulation via LPS/TLR4/CXCL1.
(A) Representative CXCR2 staining of hepatic M-MDSC and PMN-MDSC cells from three independent experiments.
(B) Absolute numbers of CXCR2+ cells in liver of control and BDL mice. Data represent mean ± SEM. n=4 for Ctr and BDL. ***p<0.001, Student’s t test.
(C) Absolute numbers of CXCR2+ cells in liver of H2O and DSS treated mice. Data represent mean ± SEM. n=5 for H2O and DSS. ***p<0.001, Student’s t test.
(D) Representative flow cytometry analysis of CXCR2+ infiltrating mononuclear cells in liver from three independent experiments.
(E) Composition of CXCR2+ infiltrating mononuclear cells in liver of control or BDL mice. Data represent pooled results from three experiments.
(F) CXCL1 mRNA expression levels were detected in liver tissues of control or BDL mice. n=5 for Ctr and BDL. Data represent mean ± SEM. ****p<0.0001, Student’s t test.
(G) Hydrodynamic injection of CXCL1 plasmid in C57BL/6 mice. The absolute numbers of PMN-MDSCs was determined 7 days later. n=5 for PBS and CXCL1. Data represent mean ± SEM. **p<0.01, Student’s t test.
(H) C57BL/6 mice were treated with 2.5% DSS for 7days. CXCL1 neutralization antibody or isotype control at 4 mg/kg was injected i.v. on day 5, 7 and 9. The mice were sacrificed at day 11. The absolute numbers of M-MDSC, PMN-MDSC and total MDSC were determined. Data represent mean ± SEM. n=4 for Iso and a-CXCL1. *p<0.05, two-way ANOVA.
(I) BDL was performed in C57BL/6 mice and the mice were treated with vehicle or SB225002 (10mg/kg, i.p. every other day). The absolute numbers of hepatic M-MDSC, PMN-MDSC and total MDSC was determined. n=5 for Vehicle and SB225002. Data represent mean ± SEM. ** p<0.01, two-way ANOVA.
(J) 2.5mg/kg LPS or saline was injected i.p. into Tlr4−/− or wild type (WT) mice. Three days later, CXCL1 mRNA levels in whole liver tissues were detected by real-time PCR. n=6 for each group. Data represent mean ± SEM. ns, no significant. ****p<0.0001, one-way ANOVA.
(K) Hepatocytes were isolated from Tlr4−/− or wild type (WT) mice. Then, hepatocytes were incubated with 100ng/ml LPS overnight. CXCL1 mRNA levels in hepatocytes was determined by real-time PCR. n=6 for each group. Data represent mean ± SEM. ns, no significant. ****p<0.0001, one-way ANOVA.
(L) C57BL/6 mice were treated with H2O or 2.5% DSS for 1cycle. Macrophage, LSEC, HSC and hepatocytes were isolated for RT-PCR to detect CXCL1 mRNA levels. n=5 for H2O and DSS. Data represent mean ± SEM. ****p<0.0001, two-way ANOVA.
(M) C57BL/6 mice (WT) or Tlr4−/− mice (KO) were lethally irradiated with 900 rad, followed by i.v. injection with 2×10⁷ bone marrow cells from WT or KO mice. Six weeks later, the mice were treated with H2O or 2.5% DSS for 1cycle. Then, mice were sacrificed for M-MDSC, PMN-MDSC and total MDSC detection. n=3 for WT to WT+ H2O, WT to KO+ H2O, KO to WT+ H2O, KO to KO+ H2O, n=7 for WT to WT+ DSS, WT to KO+ DSS, KO to WT+ DSS, KO to KO+ DSS. Data represent mean ± SEM. ns, no significant. *p<0.05, **p<0.01, two-way ANOVA.
(N and O) C57BL/6 mice (WT) were treated with H2O or 2.5% DSS for 1cycle, Alb-Cre-; Tlr4 f/f (Tlr4LWT) and Alb-Cre+;Tlr4f/f (Tlr4LKO) mice were treated with 2.5% DSS for 1cycle. Then, mice were sacrificed for hepatic M-MDSC, PMN-MDSC and total MDSC detection (N) and CXCL1 mRNA levels in whole liver tissues (O). n=3 for WT+ H2O and WT+ DSS, n=5 for Tlr4LWT+DSS and Tlr4LKO+DSS. Data represent mean ± SEM. **p<0.01, two-way ANOVA.

