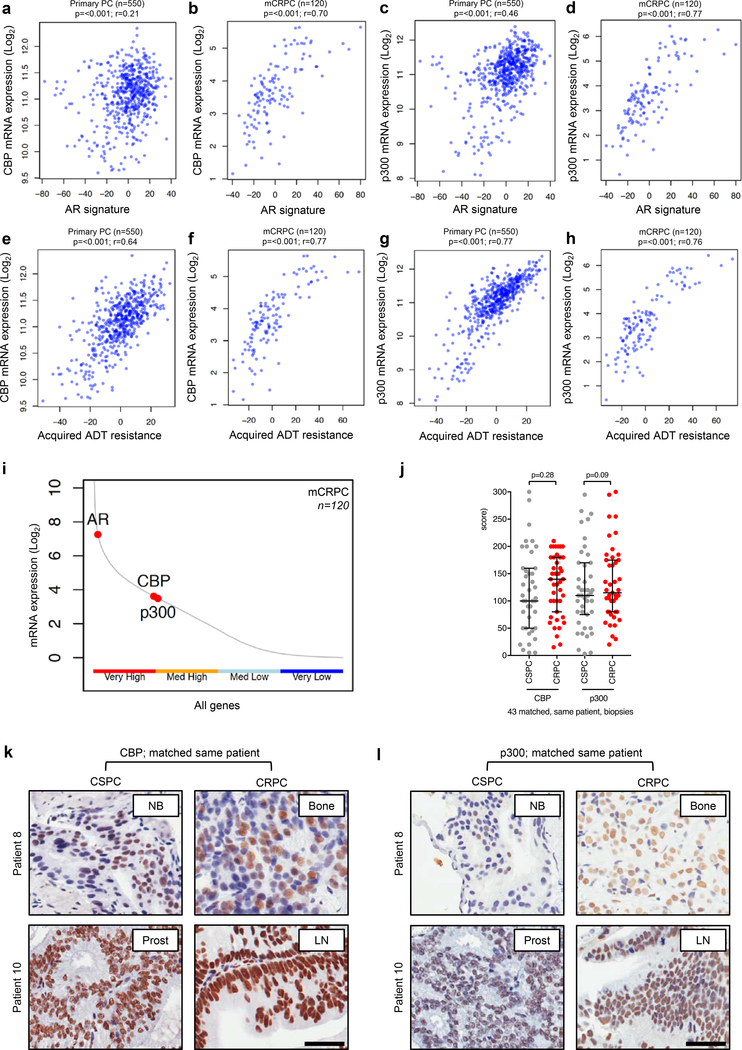
Figure 1: CBP and p300 expression and association with AR activity and acquired endocrine resistance in primary, and castration resistant, prostate cancer.
(a-d) Association between primary prostate cancer (PC) CBP (a), metastatic castration resistant prostate cancer (mCRPC) CBP (b), primary PC p300 (c), and mCRPC p300 (d) expression levels with androgen receptor (AR) signature from either TCGA primary PC expression data (a, c; n=550) or SU2C/PCF mCRPC expression data (b, d; n=120). r-values and p-values are shown and were calculated using Spearman’s correlation. (e-h) Association between primary prostate cancer (PC) CBP (e), metastatic castration resistant prostate cancer (mCRPC) CBP (f), primary PC p300 (g), and mCRPC p300 (h) expression levels with acquired androgen deprivation therapy (ADT) resistance signature from either TCGA primary PC expression data (e, g; n=550) or SU2C/PCF mCRPC expression data (f, h; n=120). r-values and p-values are shown and were calculated using Spearman’s correlation. (i) SU2C/PCF mCRPC transcriptome analyses of RNA-sequencing data from 120 patient biopsies for CBP, p300 and AR expression divided into very high (upper 25% expressed genes), medium high (50%−75% expressed genes), medium low (25%−50% expressed genes) and very low (lower 25% expressed genes). (j) Nuclear protein expression (H-score) of CBP and p300 in 43 matched, same patient, castration sensitive prostate cancer (CSPC; grey) and CRPC (red). Median H-score and interquartile range is shown. p-values were calculated using Wilcoxon matched-pair signed rank test. (k-l) Representative micrographs of CBP and p300 detection by immunohistochemistry in matched, same patient, CSPC and CRPC biopsies. Needle biopsies (NB), prostatectomies (prost), bone biopsies (bone) and lymph node biopsies (LN) are shown. Scale bar represents 50 μm.

