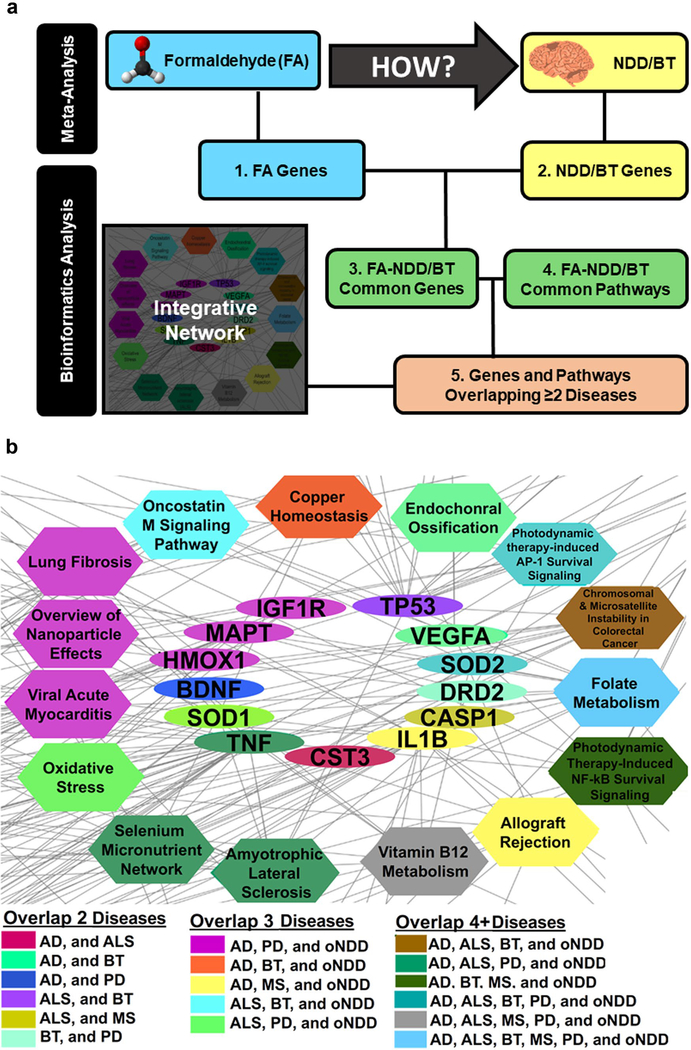
Fig. 4.
Summary of bioinformatics analysis approach. a. Definitions of numbers are explained in “Bioinformatics Approach” in the text. Close-up of the integrative network depicted in Supplementary Fig. 2, which contains the genes and pathways that were overlapping between two or more NDDs of interest b. The color of the nodes depicts the respective combinations of the different disease types. The turquoise gene SOD2 (in the middle) and the gray pathway Vitamin B12 Metabolism (at the bottom), for example, are both observed to be affected in AD, ALS, brain tumor, PD, as well as in oNDD after formaldehyde exposure b

