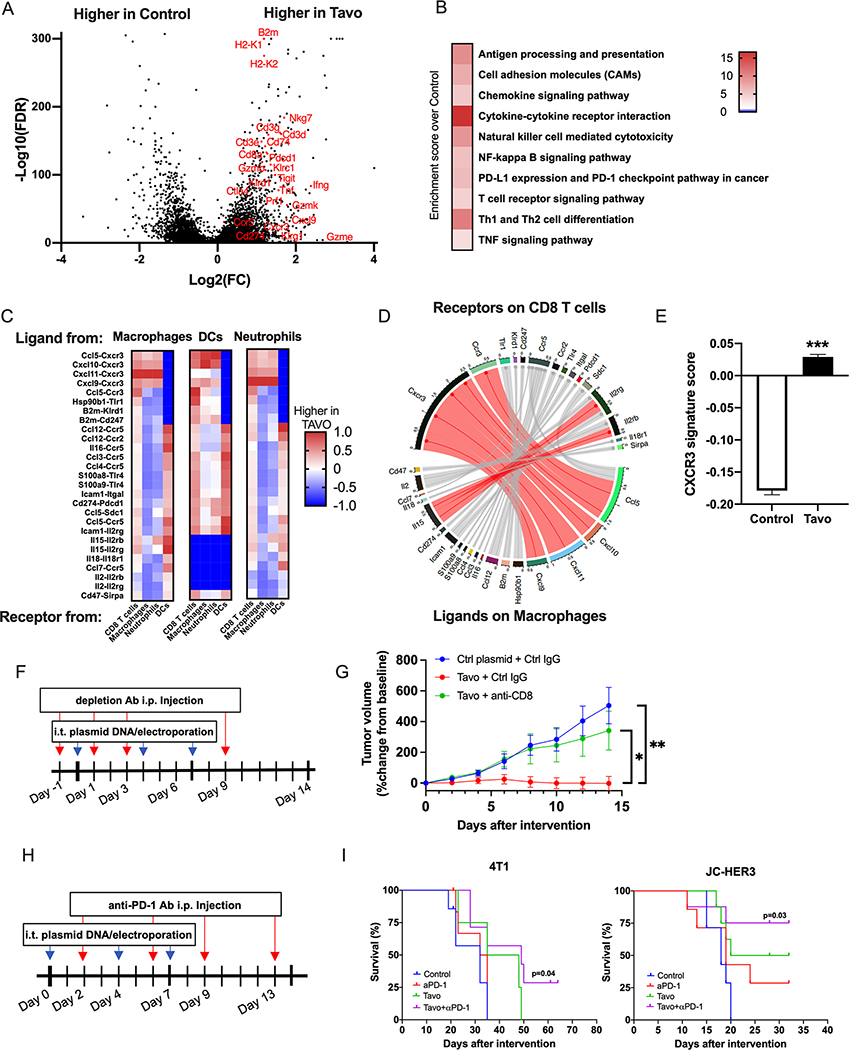
Figure 2. Tavo treatment induces expression of a CXCR3-GS, upregulates PD-1/PD-L1 pathway, and combination with anti-PD-1 enhances tumor free survival.
A. Volcano plot of differentially expressed genes in Tavo or control treated cells. Genes shown have FDR<0.05 and fold change>|2|. B. Selected KEGG pathways that are significantly enriched in Tavo treated tumors. C. Interactome scores for each indicated cell type comparing receptor-ligand interaction in control and Tavo treated cells. DC= dendritic cell D. Circos plot depicting receptor-ligand interactions between receptors on CD8+ T cells and ligands on macrophages. Connections shown in red represent the top 10% of interactions between these cell types. E. 50 gene CXCR3-GS scores quantified across all cells. F. 4T1 cells were subcutaneously implanted to the flank of BALB/c mice. When the tumor size reached 6–7 mm in diameter, mice were randomized into three groups (day 0). Mice received intratumoral administration of Tavo or control plasmid on days 0, 4 and 7, and intraperitoneal injection of anti-CD8 mAb or rat IgG1 isotype control on days −1, 1, 3, and 9. G. Tumor volumes were measured every other day (7 mice/group). H. 4T1 or JC-HER3 cells were subcutaneously implanted to the flank of BALB/c mice or HER3 transgenic mice, respectively. When the tumor size reached 6–7 mm in diameter, mice were randomized into four groups (day 0). Mice received intratumoral administration of Tavo or control plasmid on days 0, 4 and 7, and intraperitoneal injection of anti-PD-1 mAb or rat IgG2a isotype control on days 2, 6, 9 and 13. I. Survival curves of 4T1 and JC-HER3 tumor-bearing mice. All error bars represent mean ± SEM ***p<0.001

