
Figure 2: Type I IFN contributes to HLA class I expression and immunogenicity in human GIST.
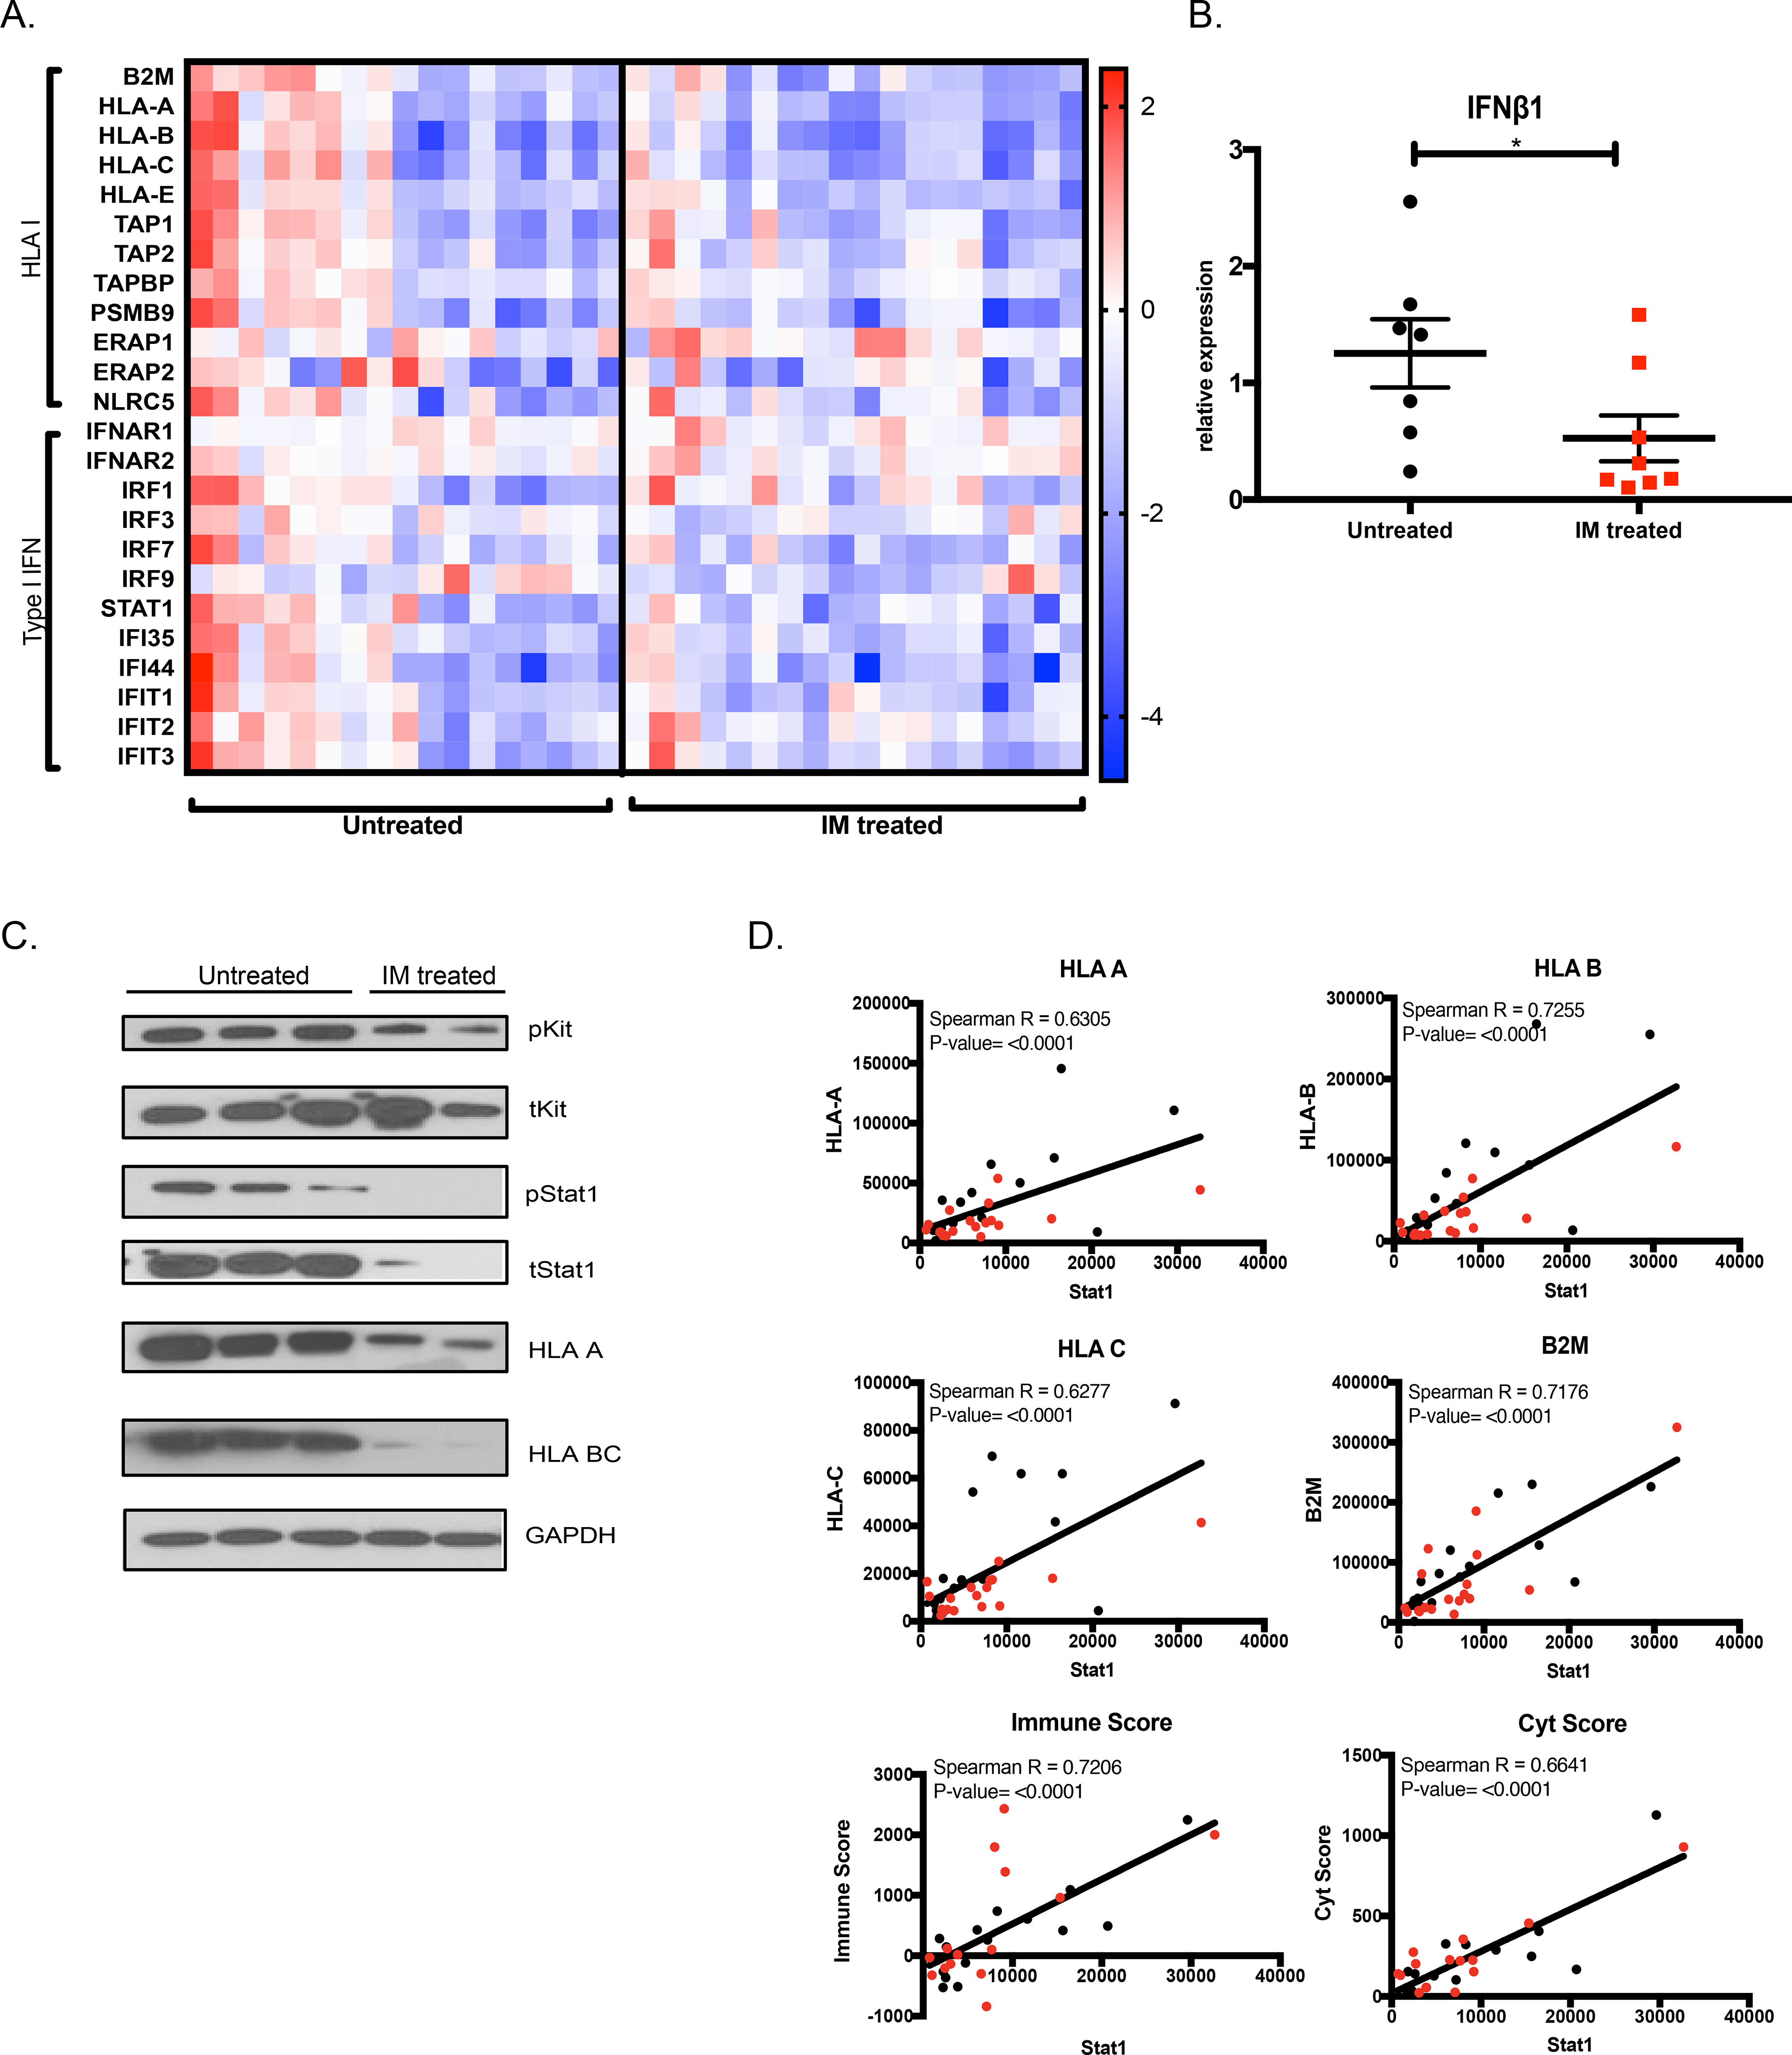
(A) Gene expression of HLA I and type I IFN genes from RNAseq of 35 human GIST specimens with and without imatinib treatment (36). Each column represents an individual patient sample. (B) RT-PCR for IFNB1 in bulk human GIST samples from patients who were not treated with imatinib (n=7) or responded to imatinib (n=8). Gene expression calculated relative to the mean expression of the untreated group. Unpaired non-parametric Mann Whitney U-test performed against the untreated group. Data represent mean ± SEM, * p-value < 0.05, ** p-value <0.01, *** p-value <0.001. (C) Immunoblot of human GIST samples probed for KIT and STAT signaling as well as HLA class I protein expression. (D) Normalized gene expression of HLA class I genes HLA A, HLA B, HLA C, and B2M, as well as Immune and Cyt scores is plotted against STAT1 expression from RNAseq of 35 human GISTs with an imatinib-sensitive mutation in KIT exon 11. Black dots represent untreated GIST and red dots represent imatinib-sensitive GISTs. Correlation represented by R2 and significance determined using Spearman correlation.