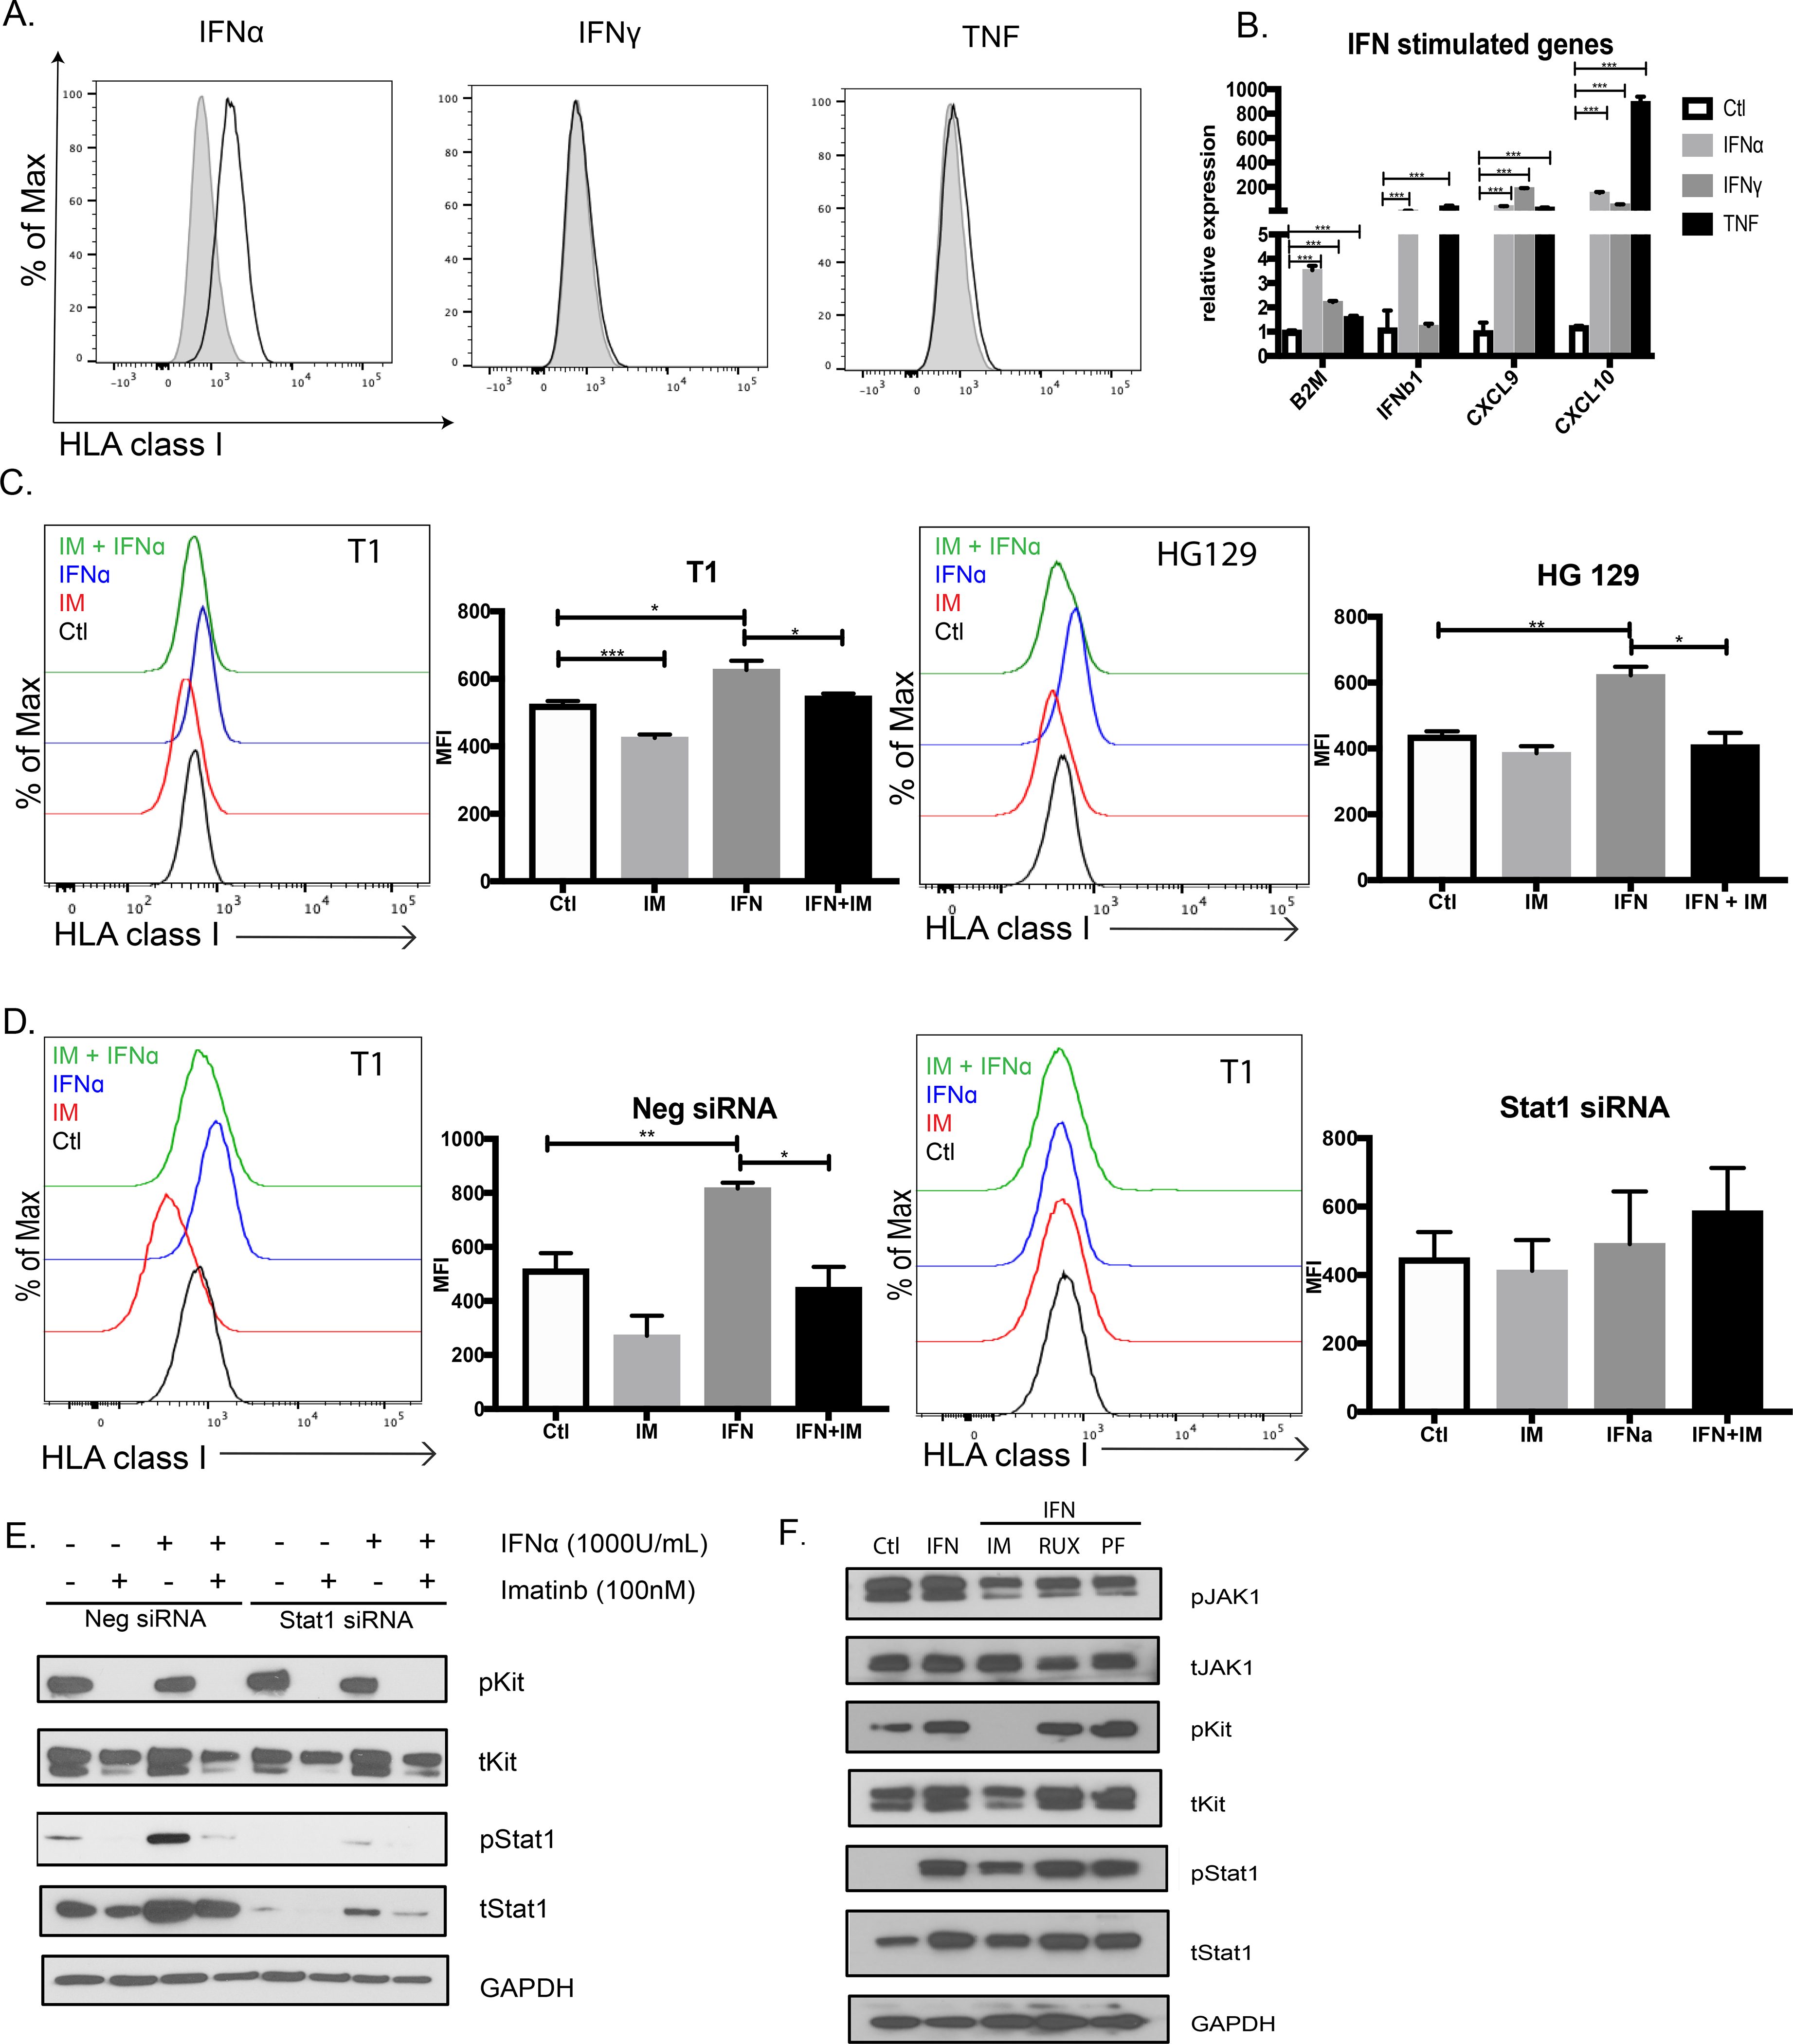
Figure 4: Kit signaling mediates IFN signaling in GIST via STAT1.

(A) Human GIST cell line T1 stimulated with IFNα (1000U/ml), IFNγ (1000U/ml) or TNF (100ng/ml) and analyzed by flow cytometry at 24h for HLA class I expression. HLA class I expression compared against isotype control. Performed in triplicates and repeated twice. (B) Interferon-stimulated gene expression in T1 cells treated with IFNα, IFNγ, or TNF for 6h. Gene expression shown relative to and compared against untreated control T1 using unpaired two-sample t-test. Data represent mean ± SEM, * p-value < 0.05, ** p-value <0.01, *** p-value <0.001. (C) GIST cell lines T1 and HG129 treated with imatinib (100nM), IFNα (1000U/ml), or both for 24h and analyzed for HLA class I expression by flow cytometry using MFI. (D) T1 cells transfected with negative or STAT1 siRNA and then treated on day 2 with imatinib (100nM), IFNα (1000U/ml), or both for 18h. Cells analyzed by flow cytometry for HLA class I expression using MFI. (E) Negative and STAT1 siRNA from (D) analyzed by immunoblot for KIT and STAT1 signaling. (F) T1 cells treated for 6h with IFNα (1000 U/ml) or IFNα in combination with imatinib (100nM), ruxolitinib (Rux, 100nM), or PF-06700841 (PF, 100nM) and then immunoblotted for KIT and STAT1 signaling.
