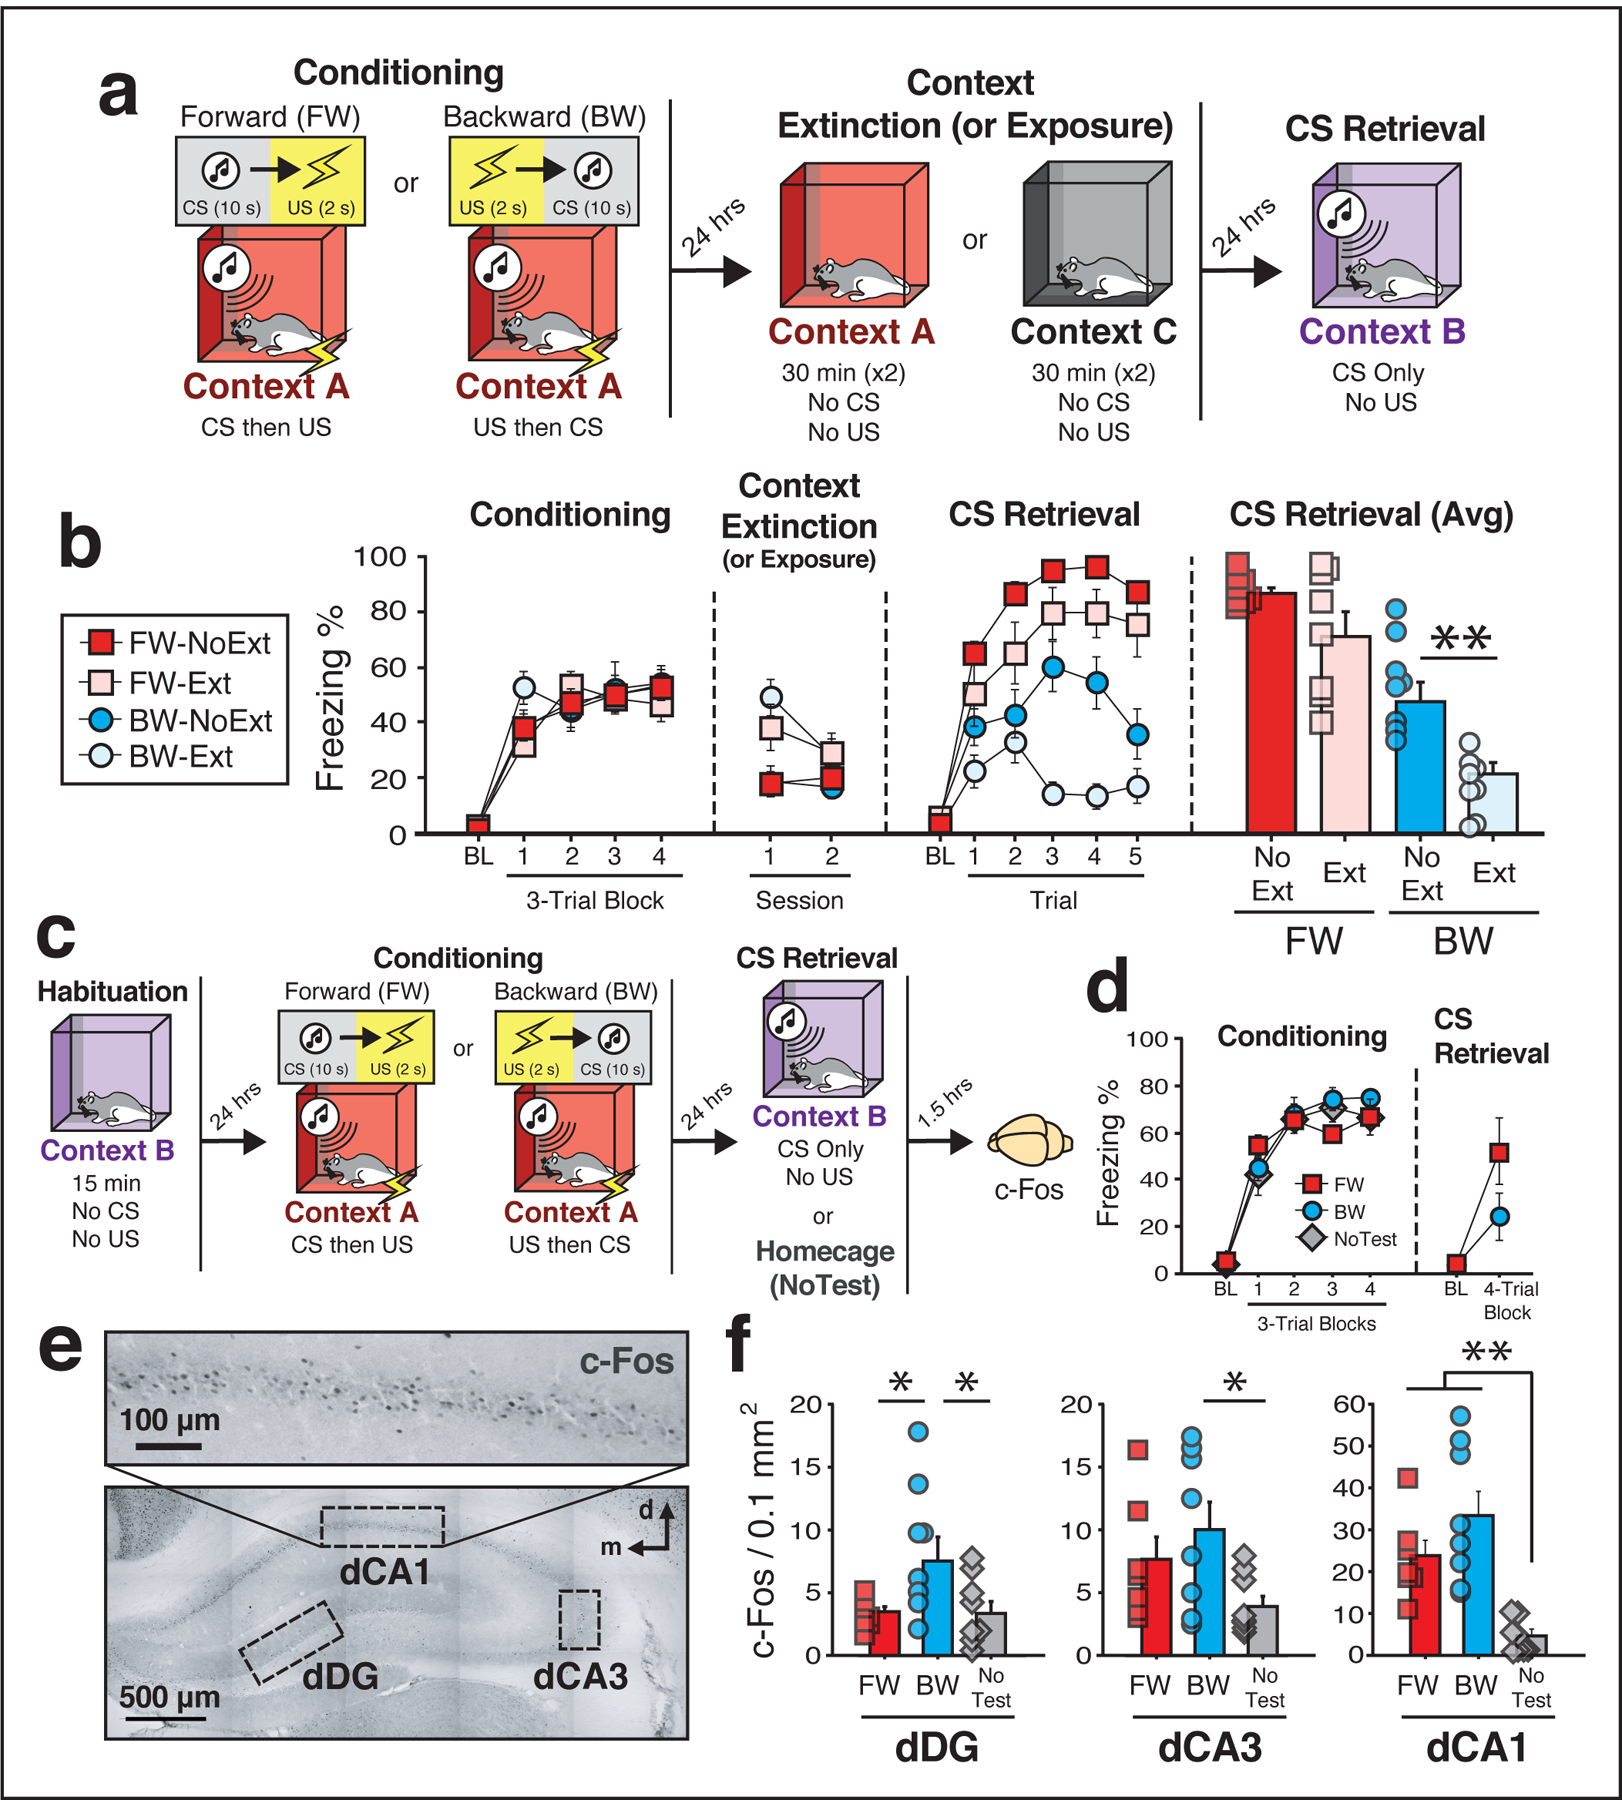
Figure 1: Conditioned freezing to a backward CS is mediated by a contextual fear memory and engages the dorsal hippocampus.

(a) Behavioral schematic. (b) Freezing behavior during conditioning, extinction, and retrieval testing. For conditioning, the left panel depicts mean percentage freezing for each group during the 5-min baseline period (BL) and across each conditioning block. For extinction, data are shown as the mean percentage freezing across the entire session for each day. For CS retrieval, data represent the mean percentage freezing during the 5-min BL and across each test trial (each trial was composed of a 10-s CS and a 60-s ISI). The right panel depicts average freezing across all test trials. Although extinction of the conditioning context did not significantly affect freezing to the FW CS, it significantly reduced freezing elicited by the BW CS (BW-NoExt vs. BW-Ext, p = 0.005), two-way analysis of variance (ANOVA) (repeated measures) followed by Bonferroni’s multiple comparisons post hoc test. Groups: [FW-NoExt (n = 8); FW-Ext (n = 8), BW-NoExt (n = 8), BW-Ext (n = 8)]. (c) Behavioral schematic. (d) Freezing behavior during conditioning and retrieval. For conditioning, the left panel depicts freezing during the 5-min baseline (BL) period and across each conditioning block. For retrieval, the right panel depicts average freezing across four retrieval trials (each trial composed of a 10-s CS and a 60-s ISI). Animals were sacrificed for c-Fos immunohistochemistry 90 min after the first retrieval trial. (e) Representative photomicrograph depicting c-Fos labeling and regions counted within the dHPC. (f) Mean c-Fos positive cells for each of the quantified regions (four to six images per subject; standardized to 0.1 mm2). In the CA1 region, presentation of either the BW or FW CS resulted in elevated levels of c-Fos expression relative to controls (BW vs. NoTest, p < 0.0001; FW vs. NoTest, p = 0.004), whereas in DG the BW CS resulted in increased levels of c-Fos relative to all other groups (BW vs. NoTest, p = 0.027; BW vs. FW, p = 0.037), one-way analysis of variance (ANOVA) followed by Fisher’s PLSD post hoc test. Groups: [FW (n = 7); BW (n = 8); NoTest (n = 8)]. All data are represented as means ± s.e.m.
