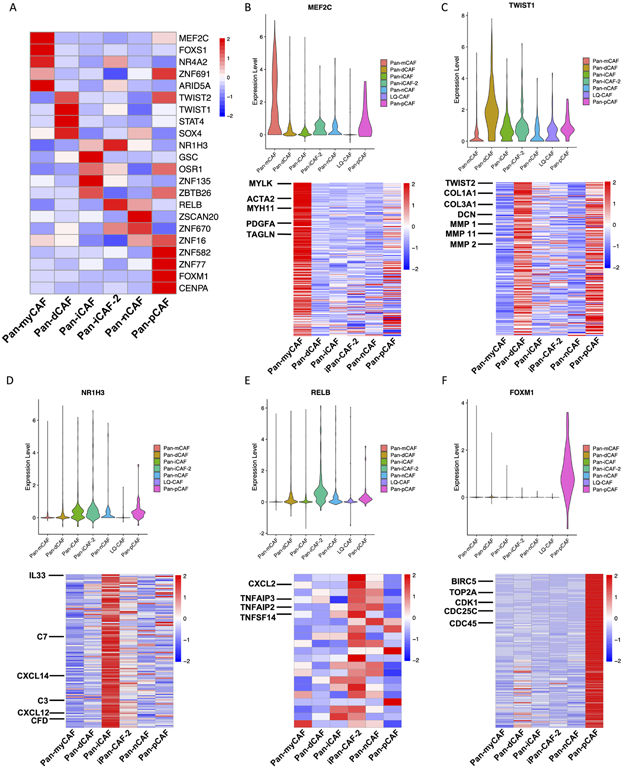
Figure 3. TFs and regulatory gene programs associated with pan-CAF subtypes.
(A) Heatmap of gene expression of transcription factors. (B) Violin plot depicting the MEF2C expression (top) and heatmap depicting MEF2C target genes upregulated in pan-myCAFs. (C) Violin plot depicting the TWIST1 expression (top) and heatmap depicting TWIST1 target genes upregulated in pan-dCAFs. (D) Violin plot depicting the NR1H3 expression (top) and heatmap depicting NR1H3 target genes upregulated in pan-iCAFs. (E) Violin plot depicting the RELB expression (top) and heatmap depicting RELB target genes upregulated in pan-iCAF-2. (F) Violin plot depicting the FOXM1 expression (top) and heatmap depicting FOXM1 target genes upregulated in pan-pCAF.

