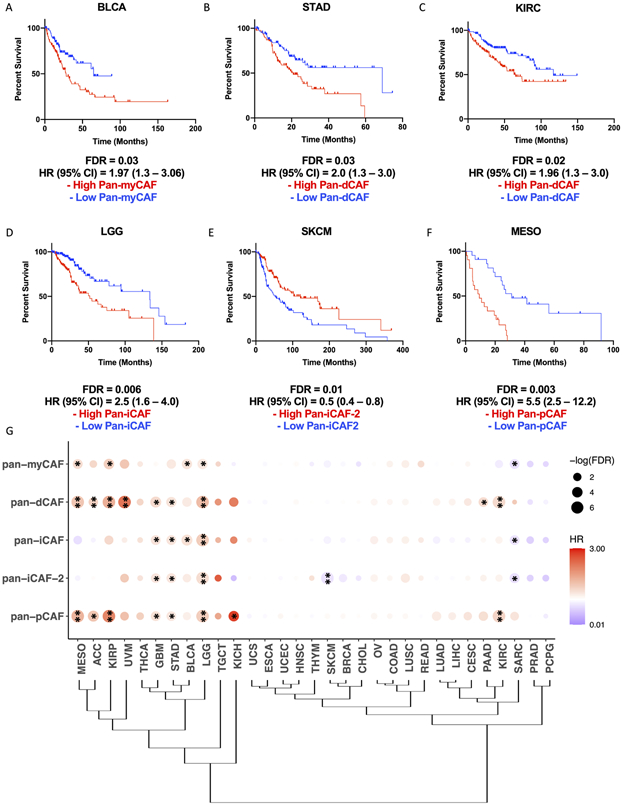
Figure 4. Specific pan-CAF subtypes linked to clinical outcome in distinct cancer types.
Kaplan-Meier plots depicting the survival differences among patients with high and low pan-myCAF in BLCA (A), pan-dCAF in KIRC (B) and STAD (C), pan-iCAF in LGG (D), and pan-iCAF-2 in SKCM (E), and pan-pCAF in MESO (F). (G) Clustering of tumor types by the hazard ratios (HRs) for the six pan-CAF gene signatures. Dot plot in which the size is related to statistical significance and the color indicates hazard ratio (red = hazard ratio above one [poor prognosis] and blue = hazard ratio below one [favorable prognosis]). * FDR < 0.05, ** FDR < 0.01.

