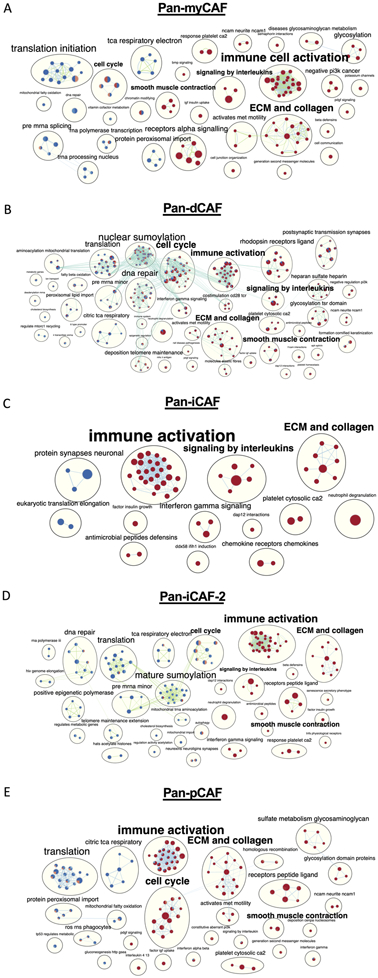
Figure 5. Networks of REACTOME terms enriched or depleted in tumors with high expression of different pan-CAF signature genes.
Nodes are terms enriched (red circles) or depleted (blue circles) among genes expressed higher in tumors with increased expression of pan-CAF gene signatures, while edges link terms with overlapping genes. Connected nodes with similar functions are further summarized by a more generalized term using Enrichmentmap. In each node, the filled colors represented results from individual cancer types. (A) pan-myCAF results from BLCA and KIRP cancers. (B) pan-dCAF results for KIRC, KIRP, LGG, UVM, MESO, and STAD cancers. (C) pan-iCAF results for LGG. (D) pan-iCAF 2 results for LGG and SKCM cancers. (E) pan-pCAF for KIRC, KIRP, LGG, and MESO.

