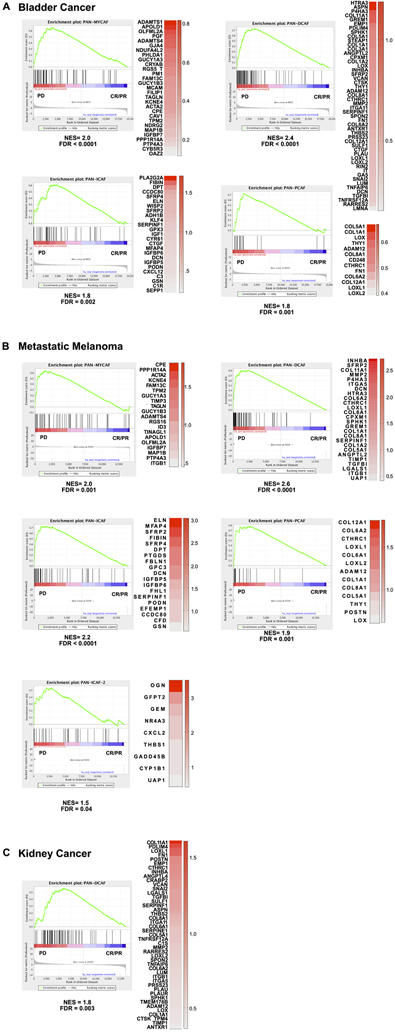
Figure 6. Pan-CAF subtypes in anti-PD1 resistant tumors.
(A) Gene set enrichment analysis for bladder tumors treated with anti-PD1 showing significant enrichment of pan-myCAF (left), pan-dCAF (left-middle), and pan-iCAF (right-middle), and pan-pCAF (right) gene signature in the progressive disease (PD) patients compared to complete response (CR) and partial response (PR) patients. (B) Gene set enrichment analysis for metastatic melanoma tumors treated with anti-PD1 treatment showing significant enrichment of pan-myCAF (left), pan-dCAF (left-middle), pan-iCAF (right-middle), pan-pCAF (right), and pan-iCAF-2 (left-bottom) gene signature in the PD patients compared to CR and PR patients. (C) Gene set enrichment analysis for kidney tumors treated with anti-PD1 treatment showing significant enrichment of pan-dCAF gene signature in the PD patients compared to CR and PR patients. The heatmaps in each panel shows the expression difference of the leading edge genes between PD and CR/PR tumors.

