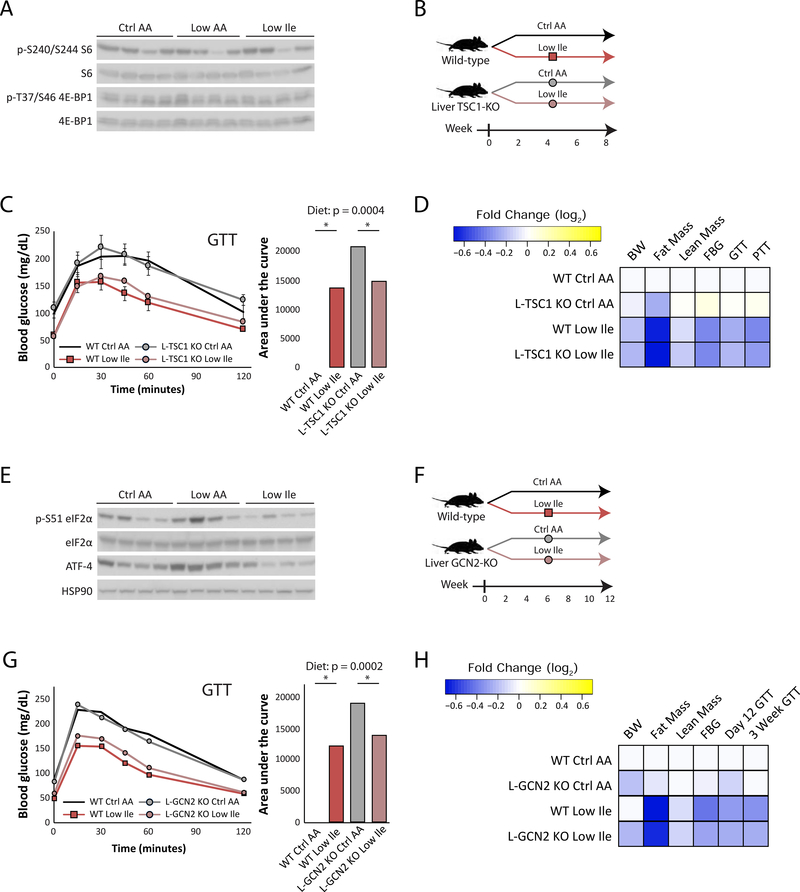
Figure 3. The metabolic effects of Ile restriction are independent of hepatic mTORC1 and GCN2 activity.
(A) Western blot analyses of mTORC1 signaling in the liver of fasted mice after 3 weeks of feeding the indicated diets. (B) Experimental scheme. (C) Glucose tolerance in WT and L-TSC1 KO mice fed the diets for 3 weeks (n=7–8/group; for AUC, statistics for the overall effects of genotype, diet, and the interaction represent the p value from a two-way ANOVA, *p<0.05, from a Sidak’s post-test examining the effect of parameters identified as significant in the two-way ANOVA). (D) Heatmap depiction of the metabolic effects of the indicated diets in WT and L-TSC1 KO mice. (E) Western blot analyses of GCN2 signaling in the liver of fasted mice after 3 weeks. (F) Experimental scheme. (G) Glucose tolerance in WT and L-GCN2 KO mice fed the indicated diets for 3 weeks (n=6–7/group; for AUC, statistics for the overall effects of genotype, diet, and the interaction represent the p value from a two-way ANOVA, *p<0.05, from a Sidak’s post-test examining the effect of parameters identified as significant in the 2-way ANOVA). (H) Heatmap of the metabolic effects of each diet. Data represented as mean ± SEM.

