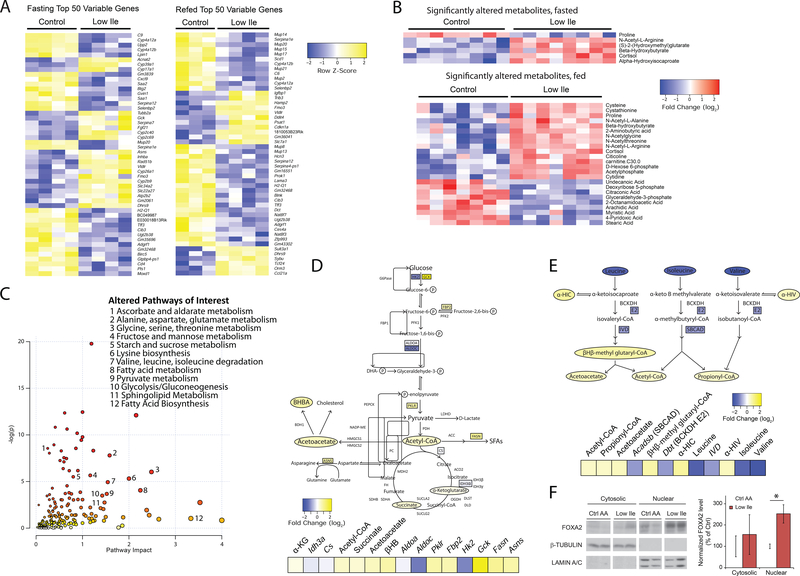
Figure 4. Ile restriction reprograms hepatic metabolism.
(A) Heatmaps of top 50 variable genes in transcriptomic analysis of Control or Low Ile-fed mouse livers. (B) Heatmaps of all significantly altered metabolites in targeted metabolite analysis of Control or Low Ile-fed mouse livers. In (A) and (B), mice were either fasted overnight or fasted overnight, then refed for 3 hours. (C) Representation of pathways altered in Low Ile-fed liver based on transcriptomic and metabolomics data. Metabolic pathways of interest are highlighted. (D) Drawn pathways in central metabolism altered in Low Ile feeding. (E) Drawn pathways in BCAA degradation altered in Low Ile feeding. Genes and metabolites colored by log2-fold change in transcriptomic and metabolomics data. Data in (C), (D), and (E) is integrated from significant changes in transcriptomic and metabolomic data gathered in the fasted state. (F) Representative cropped western blots and quantification of nuclear and cytosolic FoxA2 in the liver of fasted mice after 3 weeks of feeding the diets (n=6/group; *p<0.05, Sidak’s test post ANOVA). Data represented as mean ± SEM.

