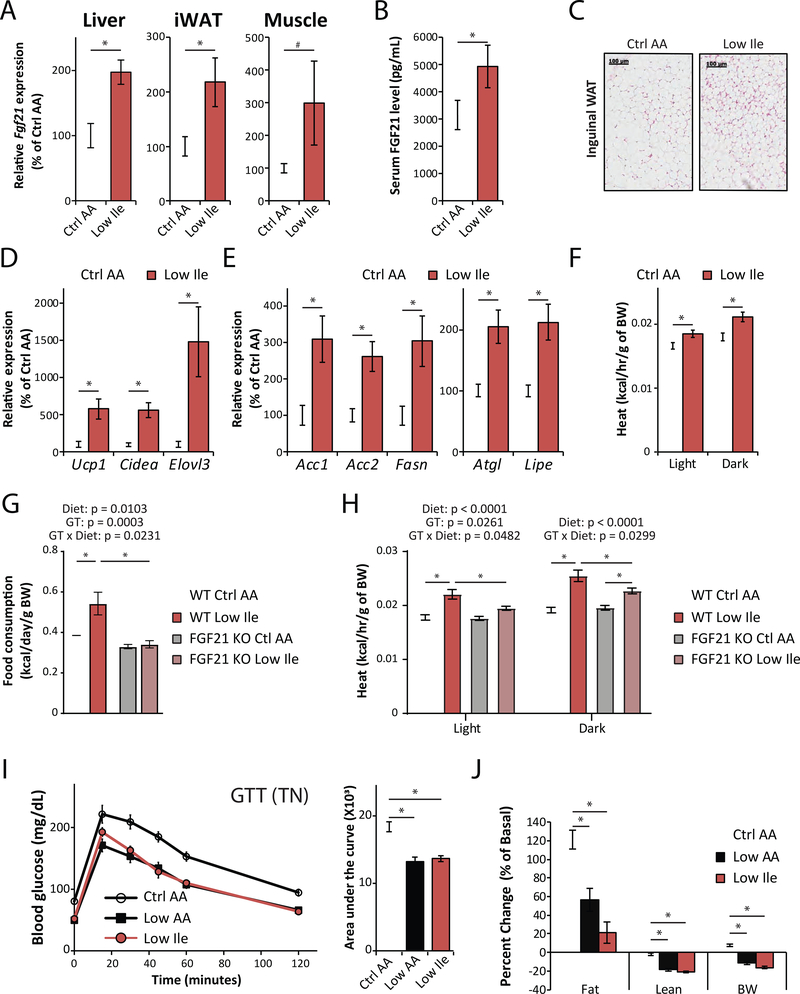
Figure 5. Reducing dietary Ile induces the FGF21-UCP1 axis and promotes energy expenditure.
(A) Fgf21 expression in the liver, inguinal white adipose tissue (iWAT) and muscle of Ctrl AA or Low Ile fed mice after 3 weeks of diet, n=8/group. (B) Plasma FGF21 level in Ctrl AA or Low Ile fed mice after 3 weeks of diet, n=5–8/group. (C) Representative images of H&E stained iWAT of Ctrl AA or Low Ile fed mice. Scale bar=100 μm. n=5–6/group. (D and E) Expression of thermogenic genes (D), lipolytic and lipogenic genes (E) in iWAT of Ctrl AA or Low Ile fed mice after 3 weeks on the indicated diets. n=8/group. (A-E) *p<0.05, t-test. (F) Energy expenditure (Heat) in mice after 6 weeks on the diets as assessed by metabolic chambers. n=5–8/group. *p<0.05, Dunnett’s test post ANOVA, considering data from all groups shown in Figure S4L. (G-H) Food consumption per gram of body weight (G) measured after 3 weeks of diet, and energy expenditure (H) measured after 12 weeks of diet to wild-type and FGF21 KO mice (n=6–9/group; the overall effect of genotype (GT), diet, and the interaction represent the p-value from a 2-way ANOVA conducted separately for the light and dark cycles; *p<0.05, Sidak’s test post 2-way ANOVA). (I and J) Glucose tolerance (I) and change in body composition (J) of mice housed at thermoneutral (TN) temperature (28.5°C) (n=12/group; *p<0.05, Sidak’s test post ANOVA). Data represented as mean ± SEM.

