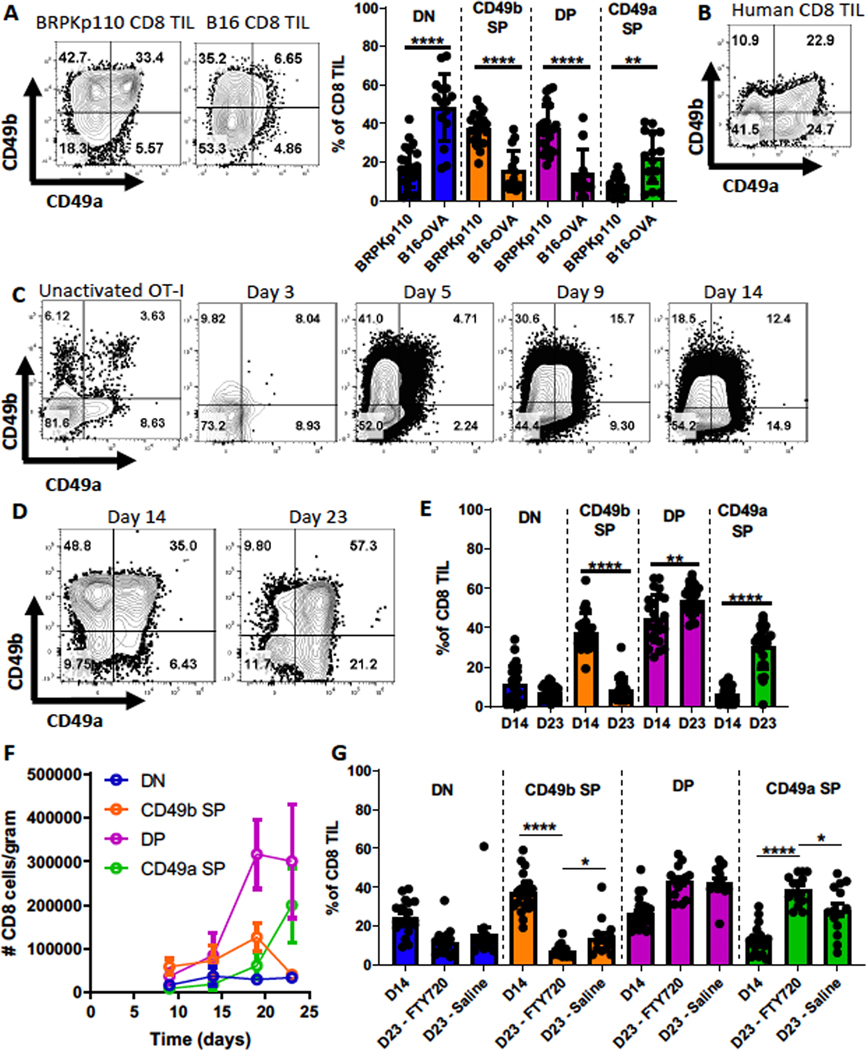
Figure 1. CD49b- and CD49a-expressing CD8+ T cells arise sequentially during immune responses.
(A) CD45+ cells from SC day 14 BRPKp110 breast carcinoma (n=21, 4 independent experiments) or B16-OVA melanoma (n=15, 3 independent experiments) were analyzed for CD49a and CD49b expression on CD3+CD8+ cells. Subsets were compared using repeated-measures (RM) one-way ANOVA and Tukey’s multiple comparisons tests. (B) Representative example of CD49a and CD49b expression on CD3+CD8+ cells from human metastatic melanoma lesions. CD8 T cells were analyzed in an earlier publication (29) and the data replotted here to enable a direct comparison with panel A. (C) Thy1.1+ OT-I splenocytes were transferred IV into C57BL/6 mice, which were subsequently immunized with OVA, polyIC, and anti-CD40. Representative CD49a and CD49b expression on Thy1.1+ CD3+ CD8+ splenocytes from OT-IxThy1.1 mice (unactivated OT-I, pre-transfer) or WT mice (post-transfer with OT-I and immunized), determined on the indicated days (n=3 mice/timepoint). (D-G) CD49a and CD49b expression on CD3+CD8+ cells from SC BRPKp110 tumors harvested on the indicated days was determined by flow cytometry. (E) n=23–24/group, 5 independent experiments. (F) n=6–8 mice/timepoint, 2 independent experiments. (G) Groups of BRPKp110-bearing mice received daily IP injections with either saline or FTY720, starting on day 14. n=14–20 mice/group, 3 independent experiments. (E-G) Groups were compared using Welch’s corrected T-test. Bar graphs and error bars indicate mean +/− standard deviation (SD). Factors of significance: *p<0.05, **p<0.01, ***p<0.001, ****p<0.0001.

