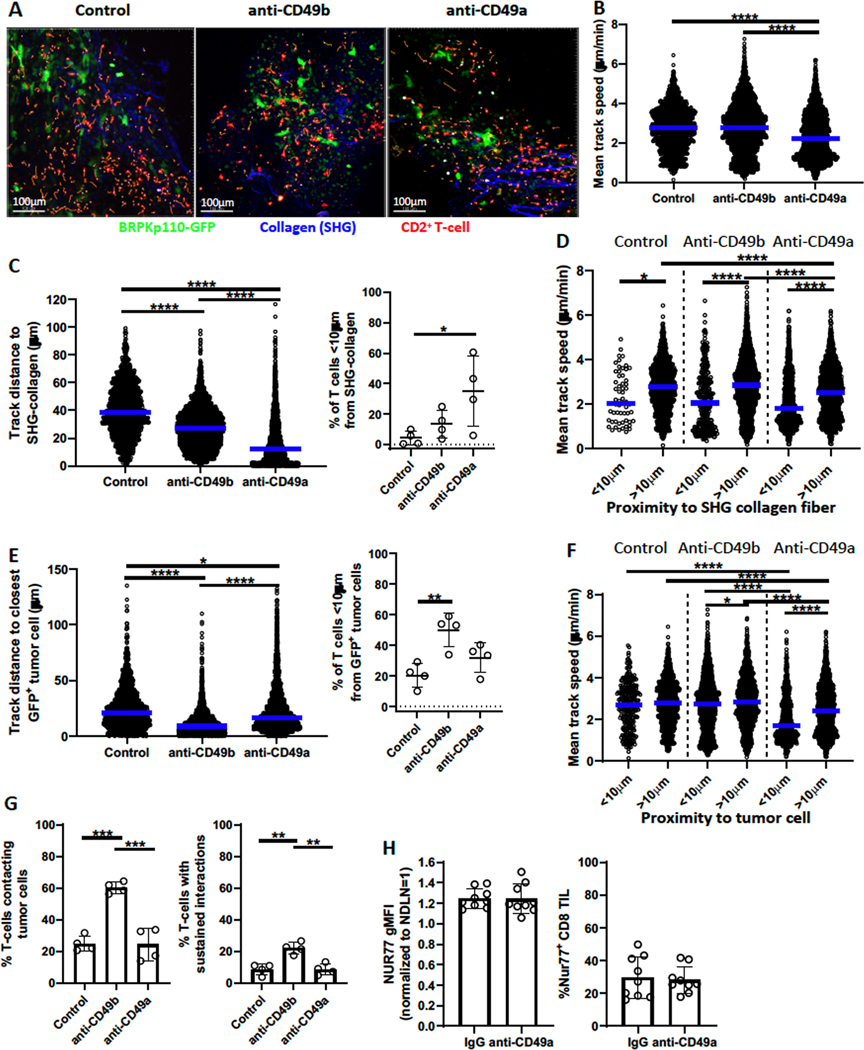
Figure 7. CD49a affects localization and motility of T cells in tumors.
Day 21/22 BRPKp110-GFP tumors implanted SC into CD2-dsRed mice were cut into slices of 100–200 microns and incubated with blocking anti-CD49a or anti-CD49b for 2 hours or left untreated. Live video image acquisition and analysis of dsRed+ T cells, GFP+ BRPKp110 cells, and SHG collagen fibers is described in Methods and Results. (A) Composite image examples. Orange tracks represent dsRed+ T-cell movement for the preceding 10 minutes. (B) Mean track speed of each CD2+ T-cell was measured over 30 minutes. Numbers of CD2+ T-cells analyzed: 1311 (control), 2872 (anti-CD49b), and 2503 (anti-CD49a). (C) Left, Average distance of each T-cell track from panel B to the closest SHG collagen fiber over 30 minutes. Right, fraction of T-cells less than 10μm from the closest SHG collagen fiber. Each data point represents one of two analyzed fields in single tumor slices taken from one of two tumors. (D) Mean track speed of each T cell from (B) stratified by distance to the closest SHG collagen fiber. (E) Left, Average distance of each T-cell track from (B) to closest BRPKp110 cell over 30 minutes. Right, fraction of T-cells less than 10μm from closest BRPKp110 cell. Each data point represents one of two analyzed fields in single tumor slices taken from one of two tumors. (F) Mean track speed of each T-cell from (B), stratified by distance to BRPKp110 tumor cells. (G) Fraction of dsRed+ T cells localized <1μm from a BRPKp110 cell for 2 or more (left panel) and 10 or more (right panel) time points during a 30–32 time point observation period. Total number of CD2-dsRed T cells analyzed per group: 887 (control), 2868 (anti-CD49b), and 2714 (anti-CD49a). (H) Nur77-GFP reporter mice implanted SC with BRPKp110 (n=9, 2 independent experiments) were injected IV with anti-CD49a or control IgG 24 hours prior to tumor harvest on day 21. Nur77-GFP expression by CD3+CD8+ tumor-infiltrating T cells was analyzed. Groups were compared with an one-way ANOVA and Tukey’s multiple comparisons tests (A-G) or a Welch’s corrected T-test (H). Bar graphs and error bars indicate mean +/− SD. Blue lines indicate median. Factors of significance: *p<0.05, **p<0.01, ***p<0.001, ****p<0.0001.

