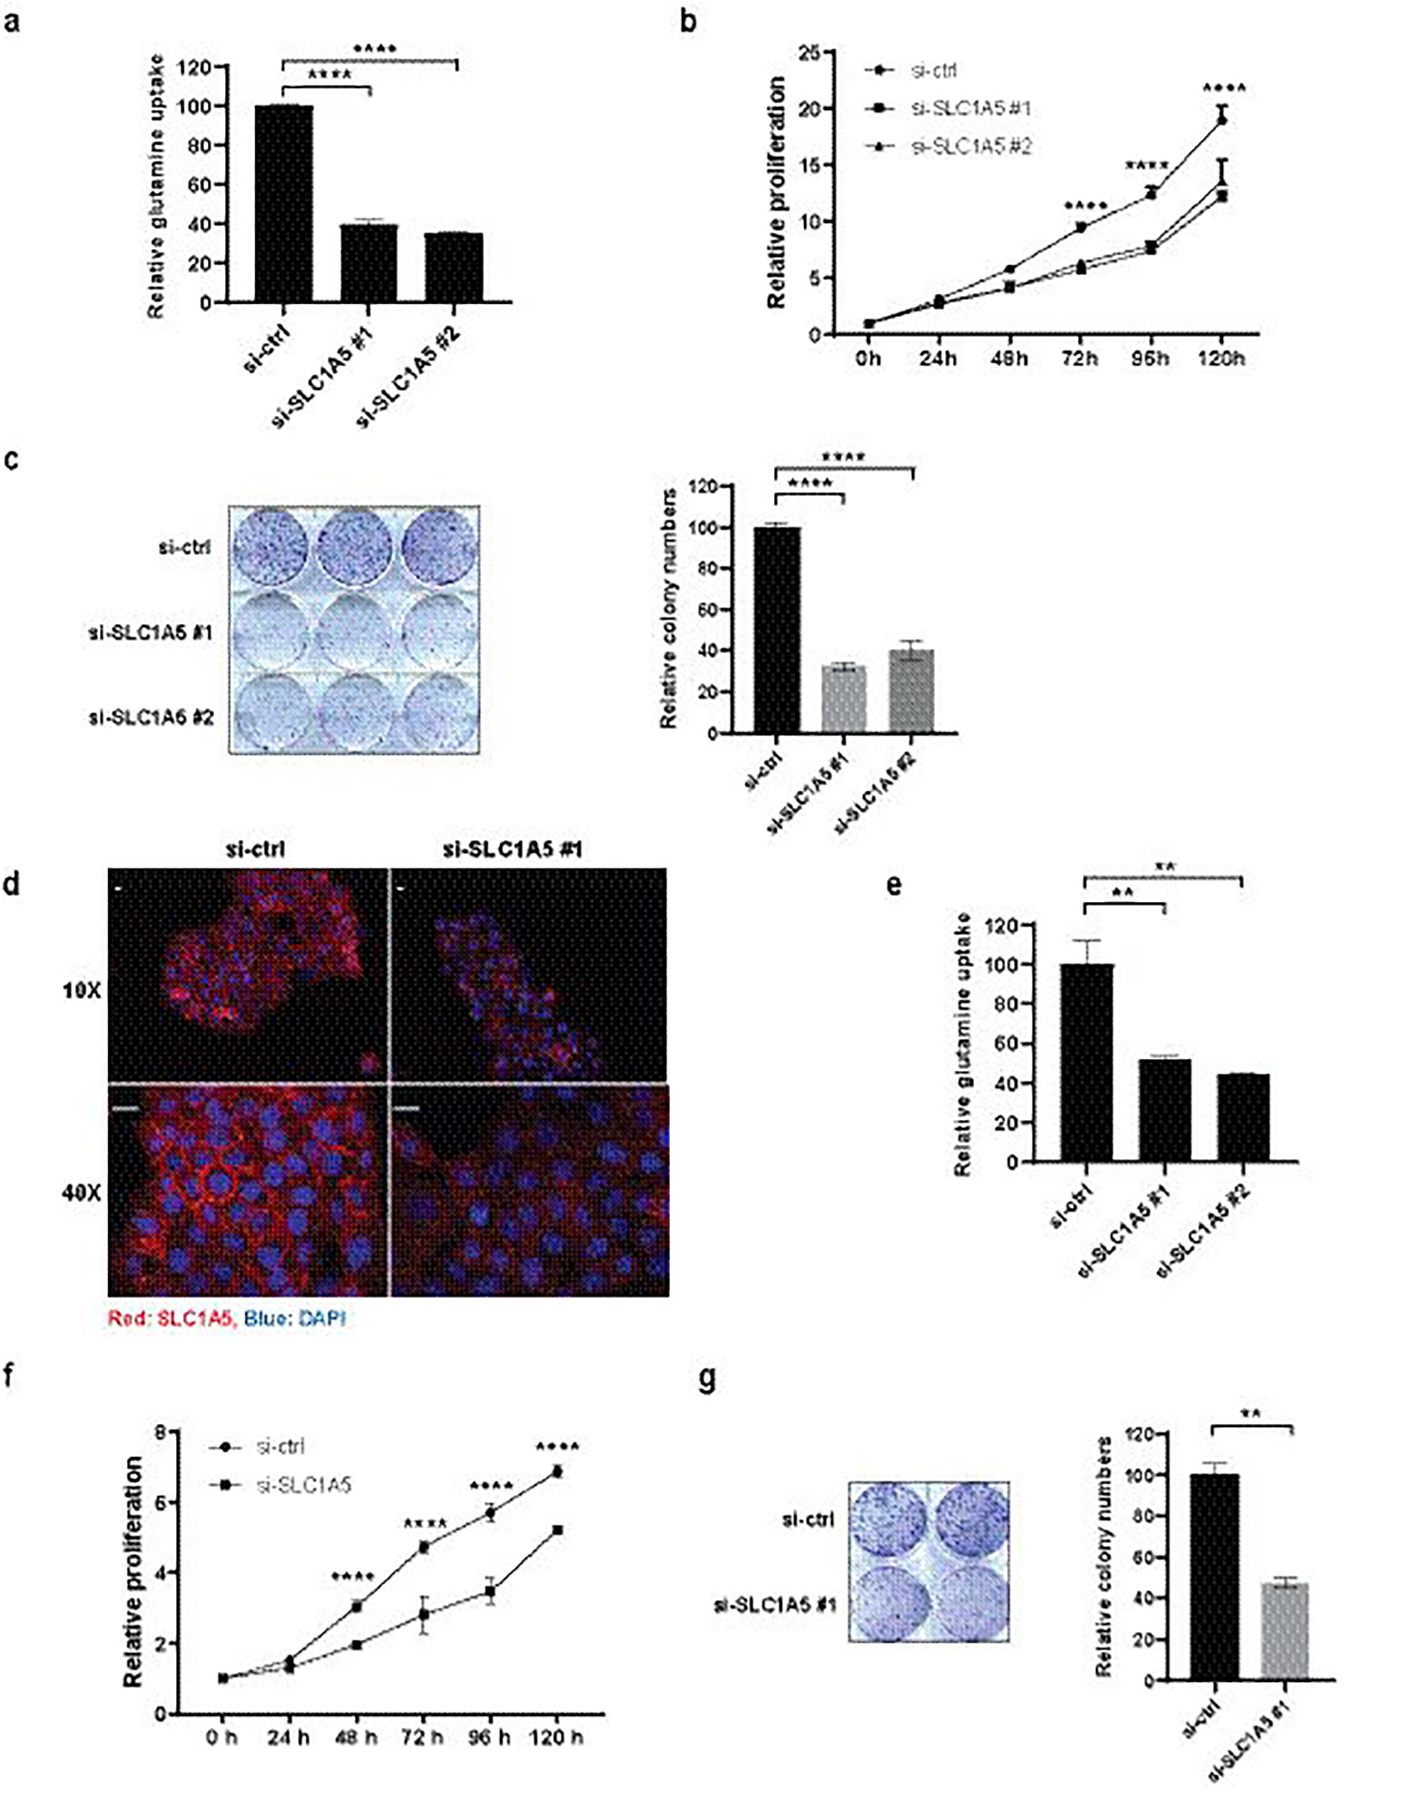
Figure 1. Inhibition of SLC1A5 Expression Suppresses Glutamine Uptake, Cell Growth and Colony Formation in Melanoma A375 Cells and Skin Epidermoid Carcinoma A431 Cells.

(a) A375 cells were transfected with si-ctrl or si-SLC1A5 for 48h followed by 3H-glutamine uptake assay. (b) A375 cells were transfected with si-ctrl or si-SLC1A5 and cell proliferation was measured for the indicated duration by ATPlite. (c) A375 cells were transfected with si-ctrl or si-SLC1A5 and colony formation assay was performed (left) and quantified (right). (d) A431 cells were transfected with si-ctrl or si-SLC1A5 for 48h followed by immunofluorescence staining with anti-SLC1A5 (red) and DAPI (blue). Scale bar, 20 μm. (e) A431 cells were transfected with si-ctrl or si-SLC1A5 for 48h followed by 3H-glutamine uptake assay. (f) A431 cells were transfected with si-ctrl or si-SLC1A5 and cell proliferation was measured for the indicated duration by ATPlite.
(g) A431 cells were transfected with si-ctrl or si-SLC1A5 and colony formation assay was performed (left) and quantified (right). Statistical analysis was performed by two-way ANOVA for time-dependent proliferation changes and by one-way ANOVA for the comparison of more than two groups. Data are shown as the mean ± SD, n = 3. *P ≤ 0.05, **P ≤ 0.01, ***P ≤ 0.001, ****P ≤ 0.0001. In (b) and (f), statistical comparison is only shown for the treatments that showed a significant change.
