
Figure 5. Combining metformin with asparaginase impairs tumor growth.
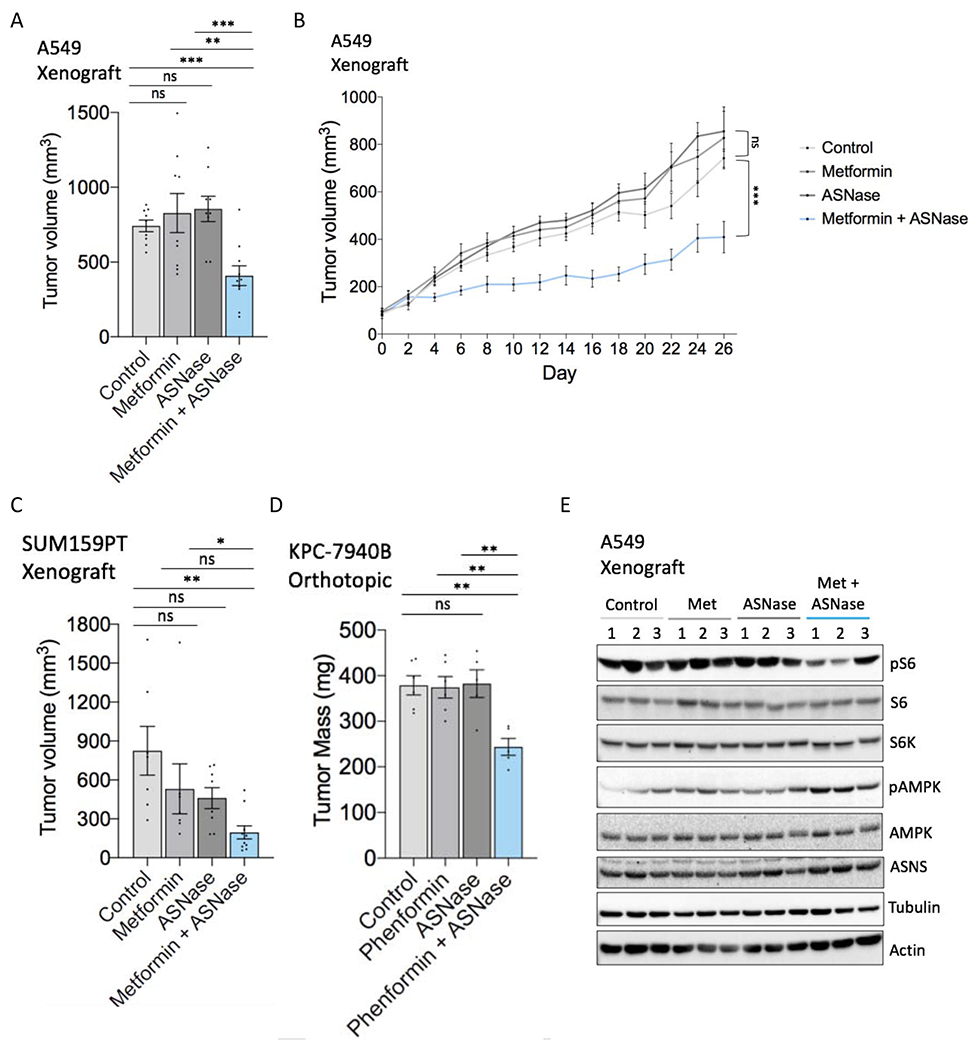
(A) Endpoint tumor volume (mm3) (day 26 of treatment) of A549 subcutaneous tumor xenografts in mice treated with metformin (250 mg/kg/day), asparaginase (ASNase) (5 IU/kg), the combination, or vehicle controls as determined by caliper measurements (n = 9-10).
(B) A549 tumor xenograft growth curves from metformin/asparaginase treatment start date through endpoint.
(C) Endpoint tumor volume (mm3) (day 21 of treatment) of SUM159PT subcutaneous tumor xenografts in mice treated with metformin (250 mg/kg/day), asparaginase (ASNase) (5 IU/kg), the combination, or vehicle controls as determined by caliper measurements. n = 7-10.
(D) Endpoint tumor mass of KPC-7940B orthotopic tumors treated with phenformin (1.7mg/mL), asparaginase (ASNase) (2 IU), the combination, or vehicle controls. n = 5-6.
(E) Immunoblot of lysates from metformin/asparaginase-treated A549 tumor xenografts shown in (A-B). Lysates were immunoblotted for mTORC1 activation marker phospho-Ser235/6 S6, total S6K, total S6, phospho-Thr172 AMPK, total AMPK, ASNS, tubulin, and actin. The three middle-sized tumors of each treatment group were chosen as representatives. Data are mean +/− s.e.; P value determined by unpaired two-tailed t-test: *p<0.05; **p<0.01; ***p<0.001; ns, not significant. See also Figure S4.