
Figure 4.
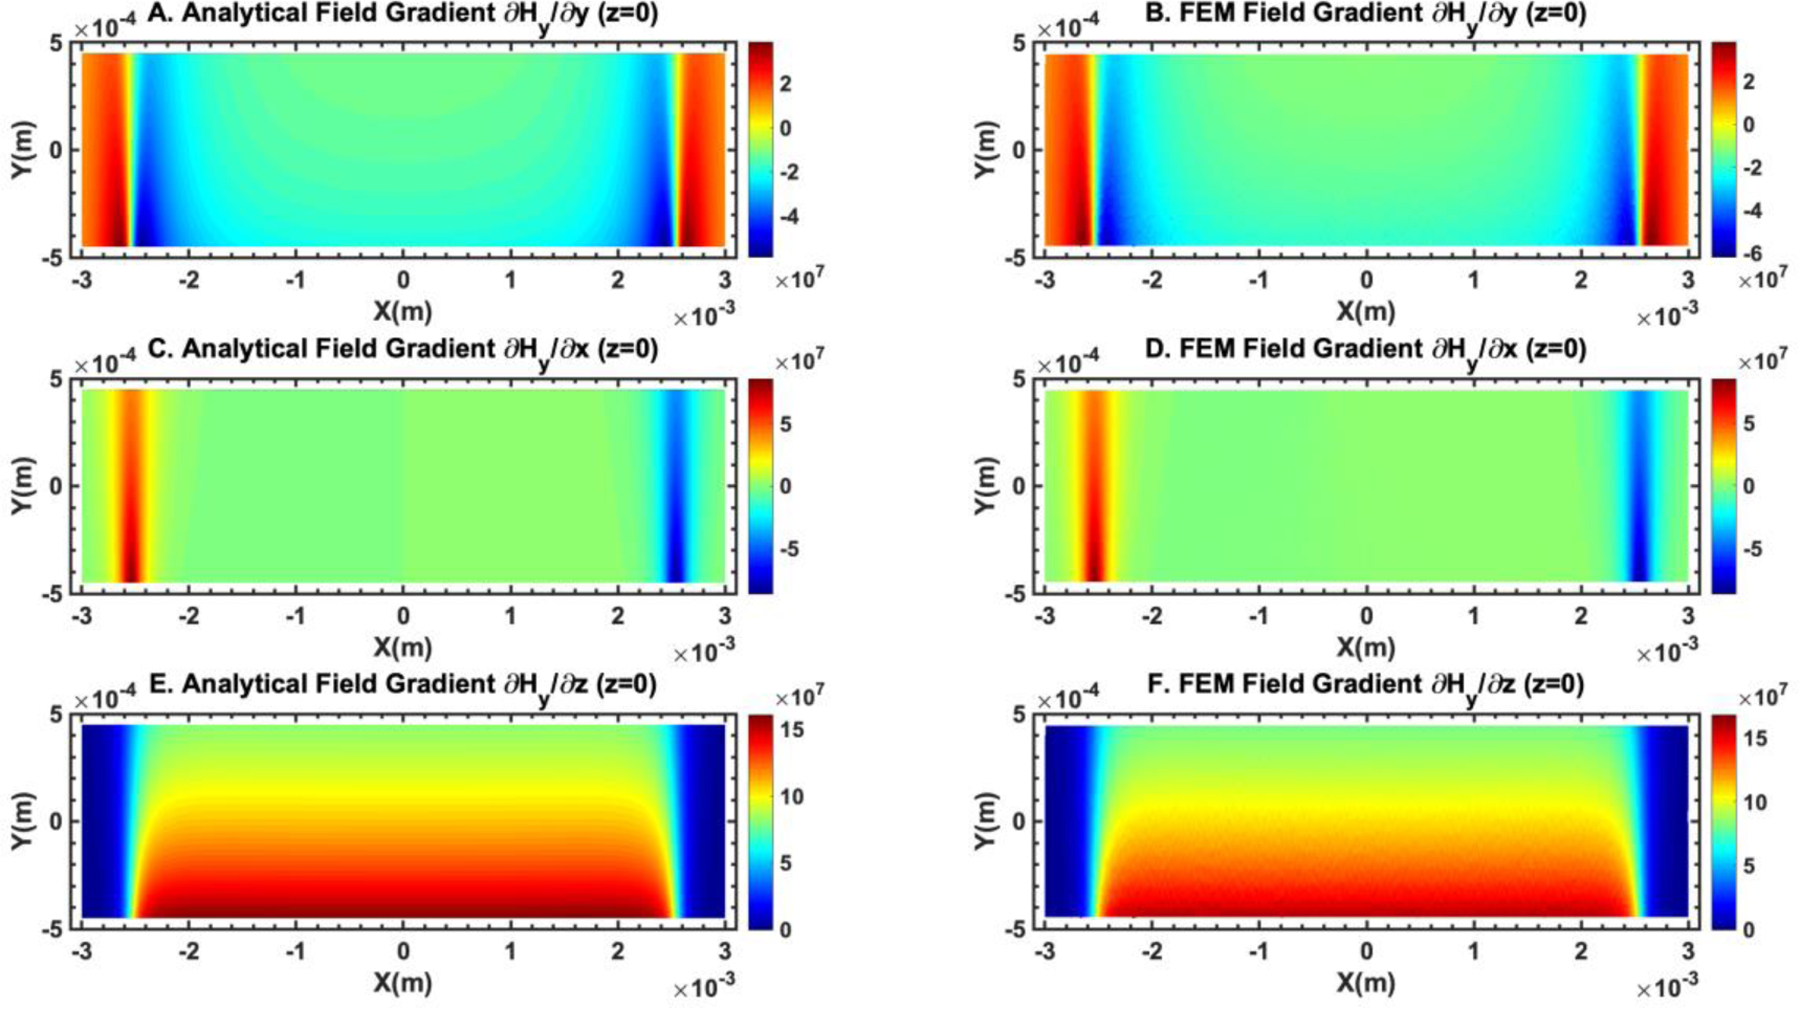
Comparison of the gradient of the magnetic field obtained from analytical expressions and finite element method simulation (COMSOL Multiphysics version 3.5) showed good agreement between the two. (A) and (B) show the comparison of . The unit of the color bar is A2/m. (C) and (D) show the comparison of . The unit of the color bar is A2/m. (E) and (F) show the comparison of . The unit of the color bar is A2/m. The plane of the field distribution is at z = 0 (center of the microchannel in the z direction).