
Extended Data Fig. 4. APP/PS1Axl−/−Mertk−/− microglia are unresponsive to Aβ plaques.
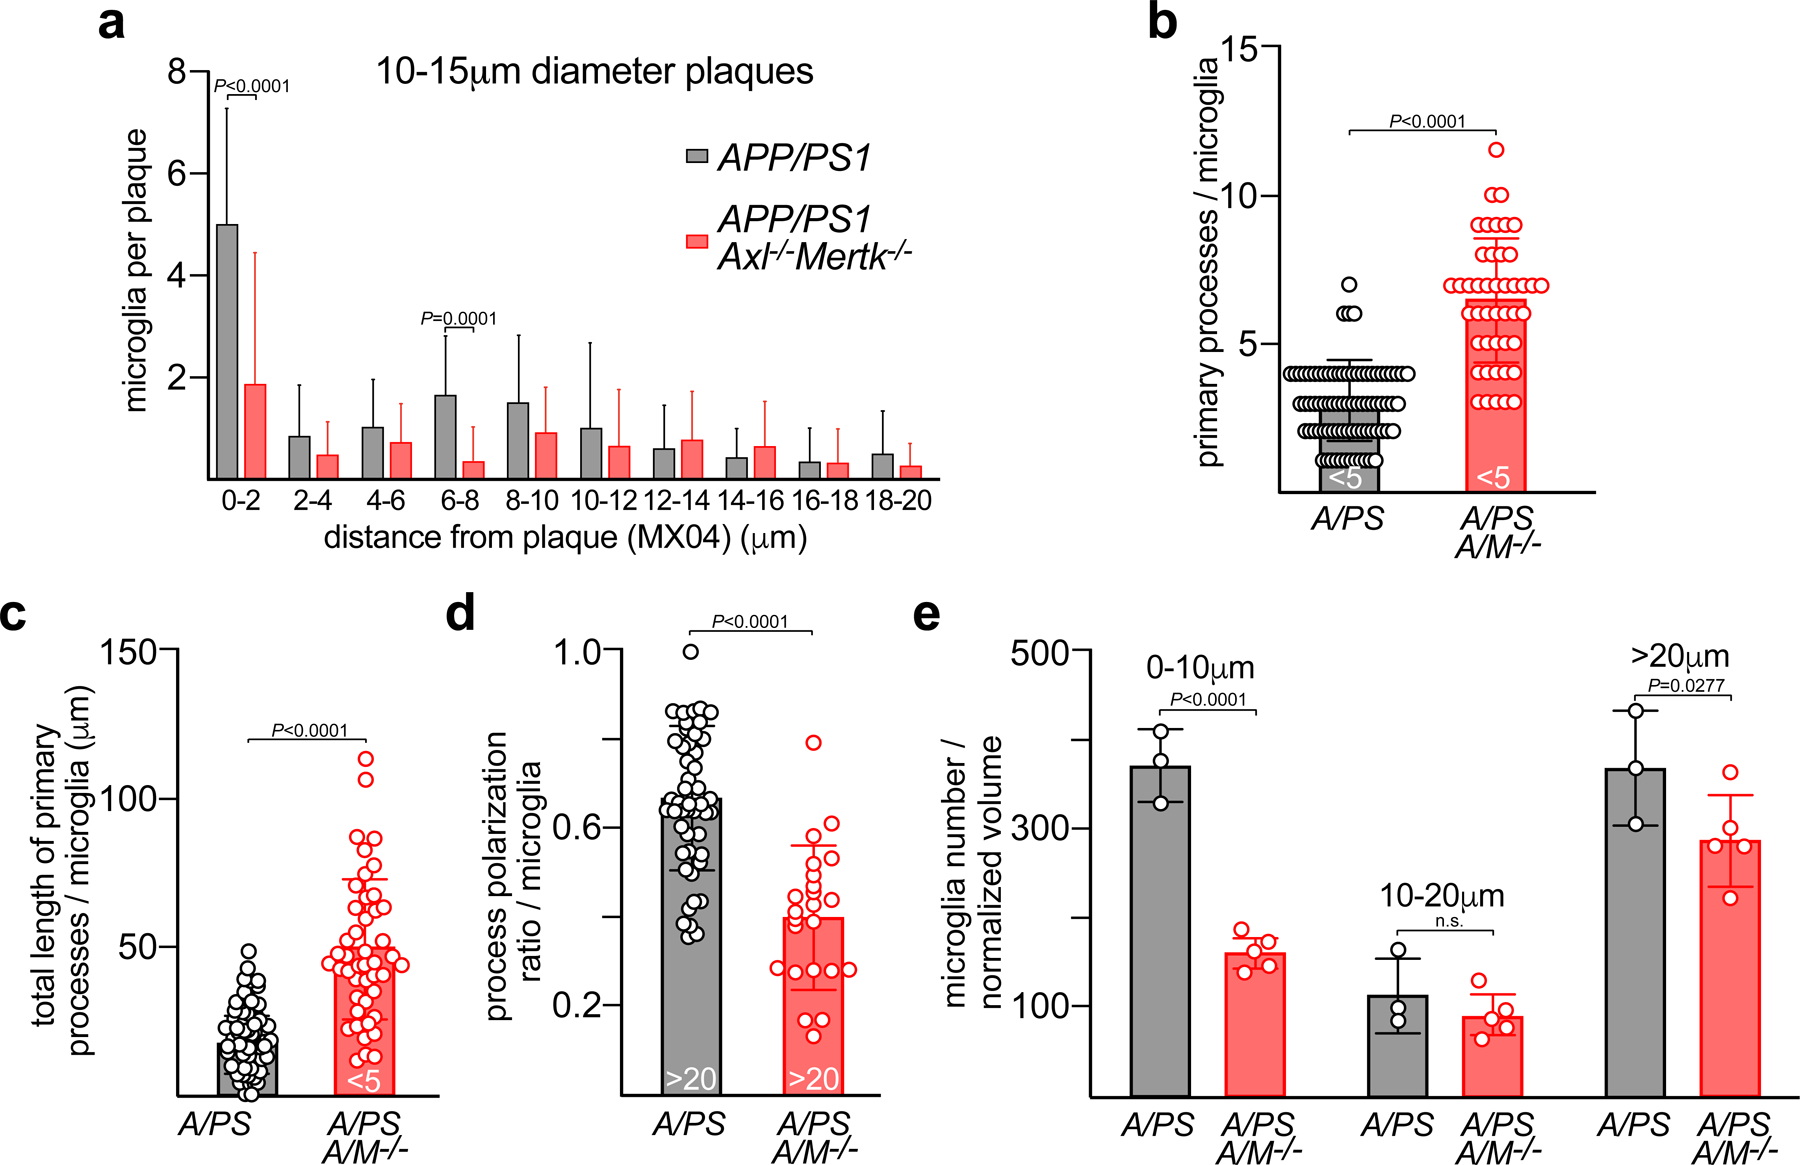
(a) Distribution of distance of microglial cell body centroids, in 2μm bins, from the edge of MX04-labeled Aβ plaques with diameters of 10–15μm in APP/PS1 (gray) and APP/PS1Axl−/−Mertk−/− (red) cortex. Values obtained for 56 and 23 plaques from 3 and 4 mice for APP/PS1 and APP/PS1Axl−/−Mertk−/−, respectively. (b) Number of imaged GFP+ primary processes per PAM (microglia <5μm from plaques) in APP/PS1 (gray, A/PS) and APP/PS1Axl−/−Mertk−/− (red, A/PS A/M−/−) cortex. (c) Summed length of primary microglial processes per PAM in APP/PS1 (gray) and APP/PS1Axl−/−Mertk−/− (red) cortex. (d) Process polarization ratio to nearest plaque per NPAM (microglia >20μm from plaques; see Materials and Methods) in APP/PS1 (gray) and APP/PS1Axl−/−Mertk−/− (red) cortex. (e) Quantification of microglial cell density in the cortex of 16 mo APP/PS1 (gray) and APP/PS1Axl−/−Mertk−/− (red) mice for microglia 0–10 μm, 10–20 μm, and >20 μm from the edge of the nearest plaque. Data points are from 45–129 cells (PAM) investing 10–29 plaques (b, c), and 21–49 cells peripheral to 7–24 plaques (d) from n = 3 mice per genotype (b–d). Points in e represent 3–5 imaging volumes from 3 APP/PS and 4 APP/PS1Axl−/−Mertk−/− mice. Two-way ANOVA with Sidak’s multiple comparison test (a, e) and Mann-Whitney’s test (b-d). Data are represented as mean ±1 STD.