
Extended Data Fig. 1. Expression of Axl, Mer, TMEM119, Trem2, and GFAP in plaque-burdened AD brains.
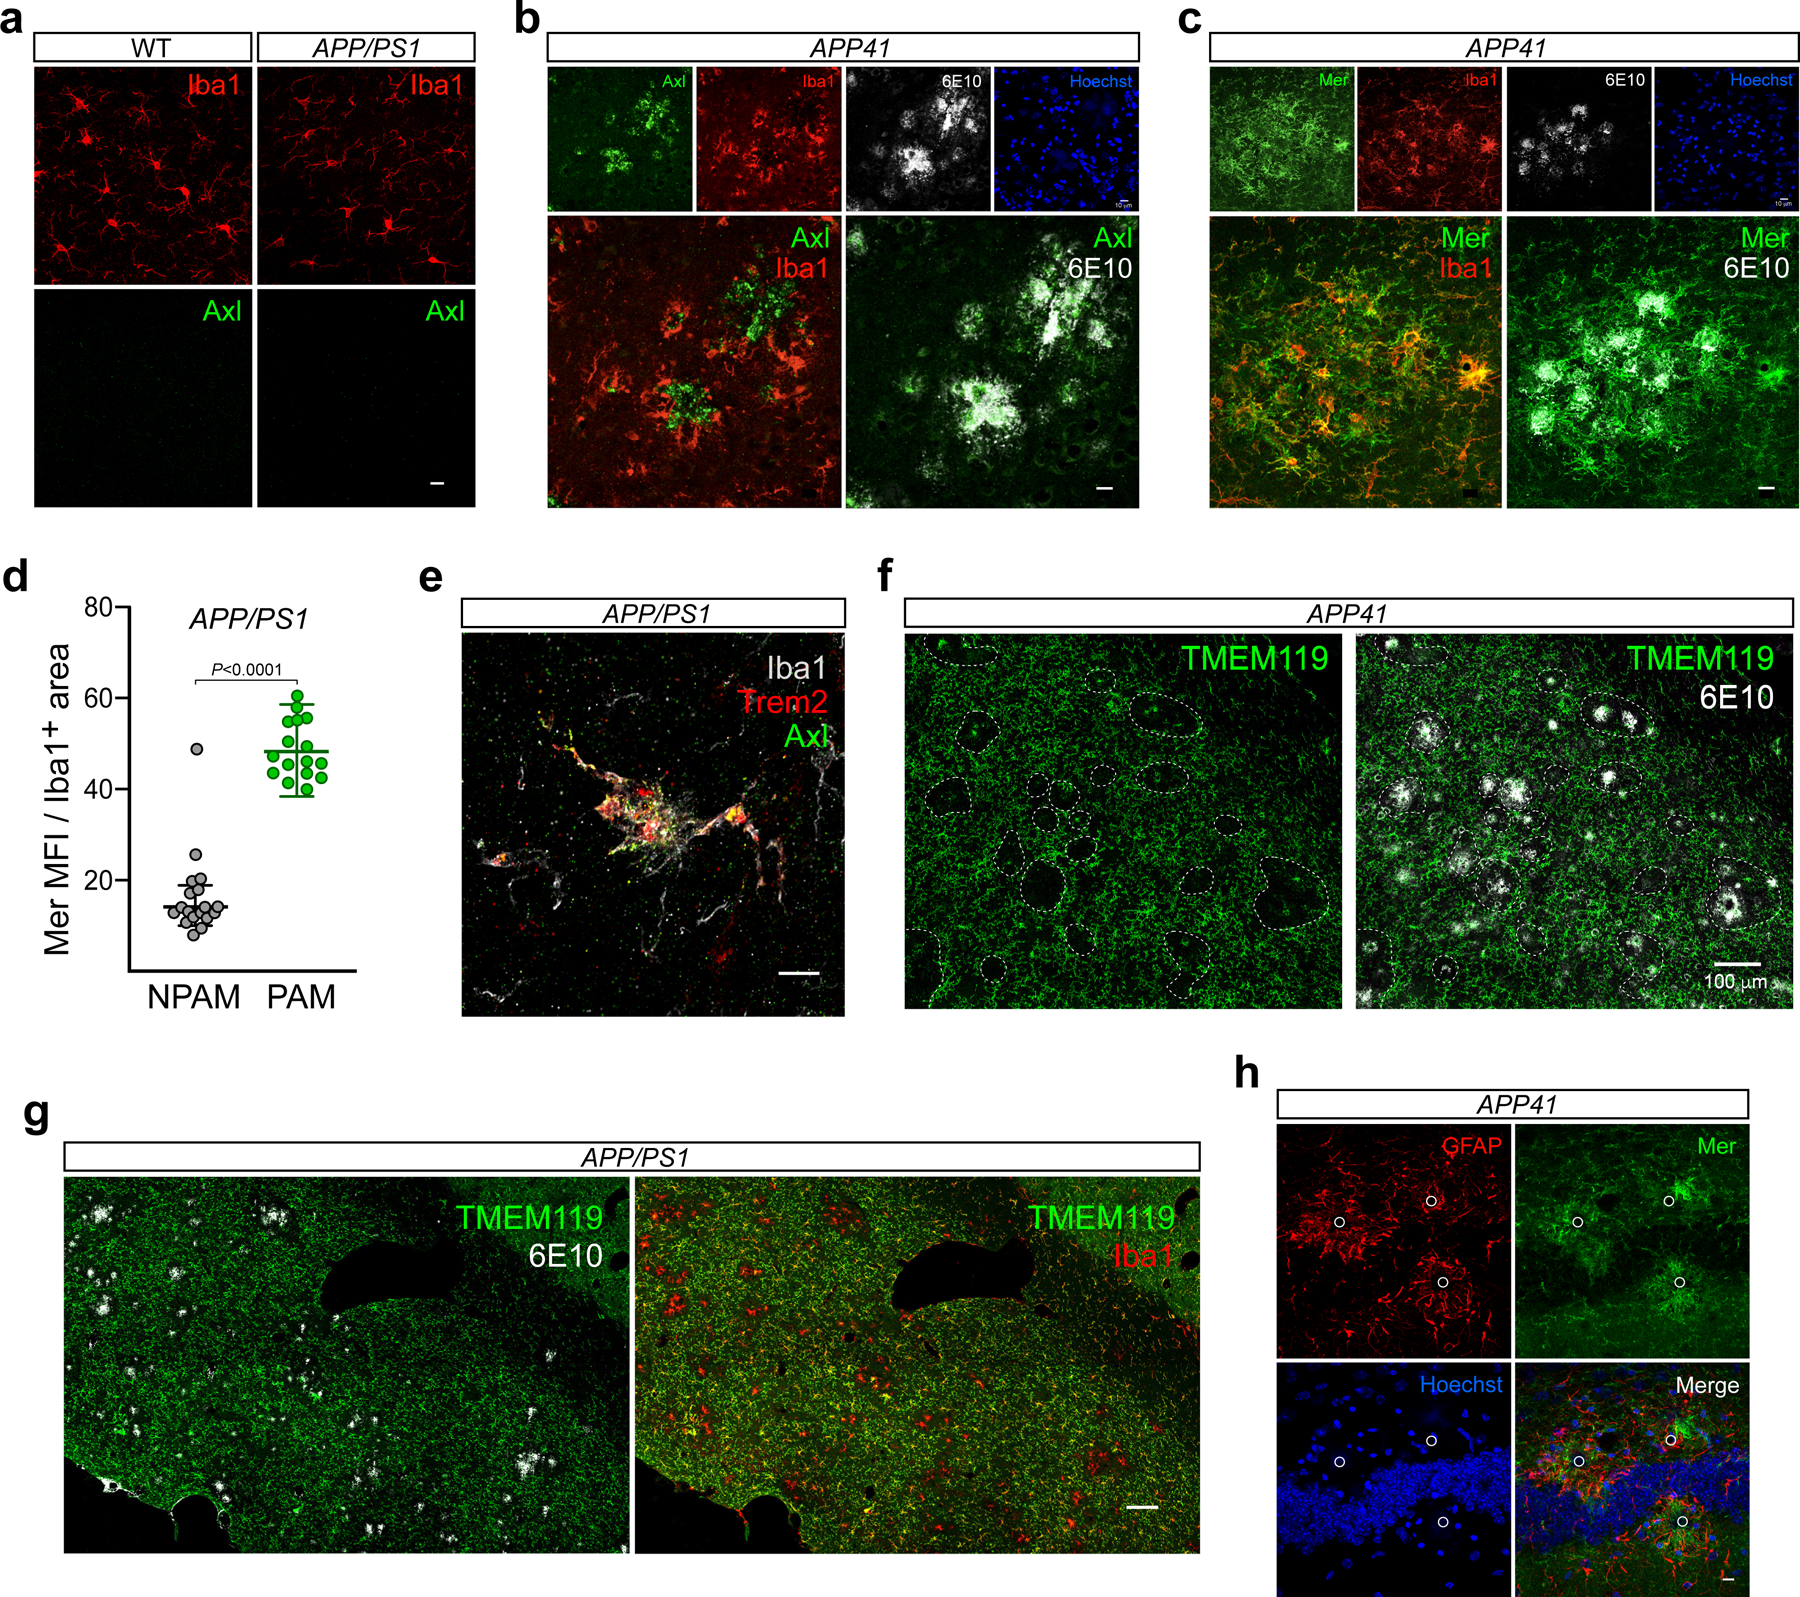
(a) Axl protein (green, lower panels) is undetectable in WT (left) and APP/PS1 (right) microglia (Iba1, red, upper panels) in the 4mo cortex, prior to the appearance of plaques in APP/PS1 mice. n = 3 per genotype. (b) Axl protein (green) in 15 mo APP41 mice (n = 3) is up-regulated in cortical microglia (Iba1, red) contacting Aβ plaques (6E10, white), and is also often concentrated in plaque centers, consistent with strong prior activation of Axl and subsequent cleavage of its ectodomain. (As is seen for other RTKs, robust activation of Axl results in nearly complete cleavage of the ectodomain from the cell surface.) Hoechst 33258 stains nuclei. (c) Expression of Mer protein (green) in 15 mo APP41 mice is seen in all cortical microglia (Iba1, red), but is further up-regulated in microglia that invest Aβ plaques (6E10, white). (d) Quantification of Mer up-regulation in Iba1+ plaque-associated microglia (PAM) versus non-plaque-associated microglia (NPAM) in APP/PS1 mice at 9.5 months. (e) Axl (green) and Trem2 (red) are up-regulated in the same Iba1+ (white) microglia cell in the 9.5 mo APP/PS1 cortex. (f) Expression of the homeostatic microglial marker TMEM119 (green) is lost in cortical microglia that surround plaques (6E10, white) in 15 mo APP41 mice, except for an occasional 1–2 cells at the center of plaques. (g) This same TMEM119 down-regulation is seen in 15 mo APP/PS1 mice. TMEM119− microglia surrounding 6E10+ plaques are strongly Iba1+. (h) The up-regulated Mer expression (green) seen in 15 mo APP41 mice is not in GFAP+ reactive astrocytes (red). (Activated S100b+ astrocytes are also negative for Mer expression by IHC1). Circles mark the position of Aβ plaques. Representative images obtained from immunostaining of N ≥ 3 sections from n ≡ 3 mice of each genotype. Scale bars: 10μm (a–c, e, h), 100μm (f, g). Mann-Whitney test (d). For all supplementary figure panels, data are represented as mean ±1 STD.