
Extended Data Fig. 3. Transcriptomics of APP/PS1 and APP/PS1Axl−/−Mertk−/− microglia as quantified by single cell RNA-seq.
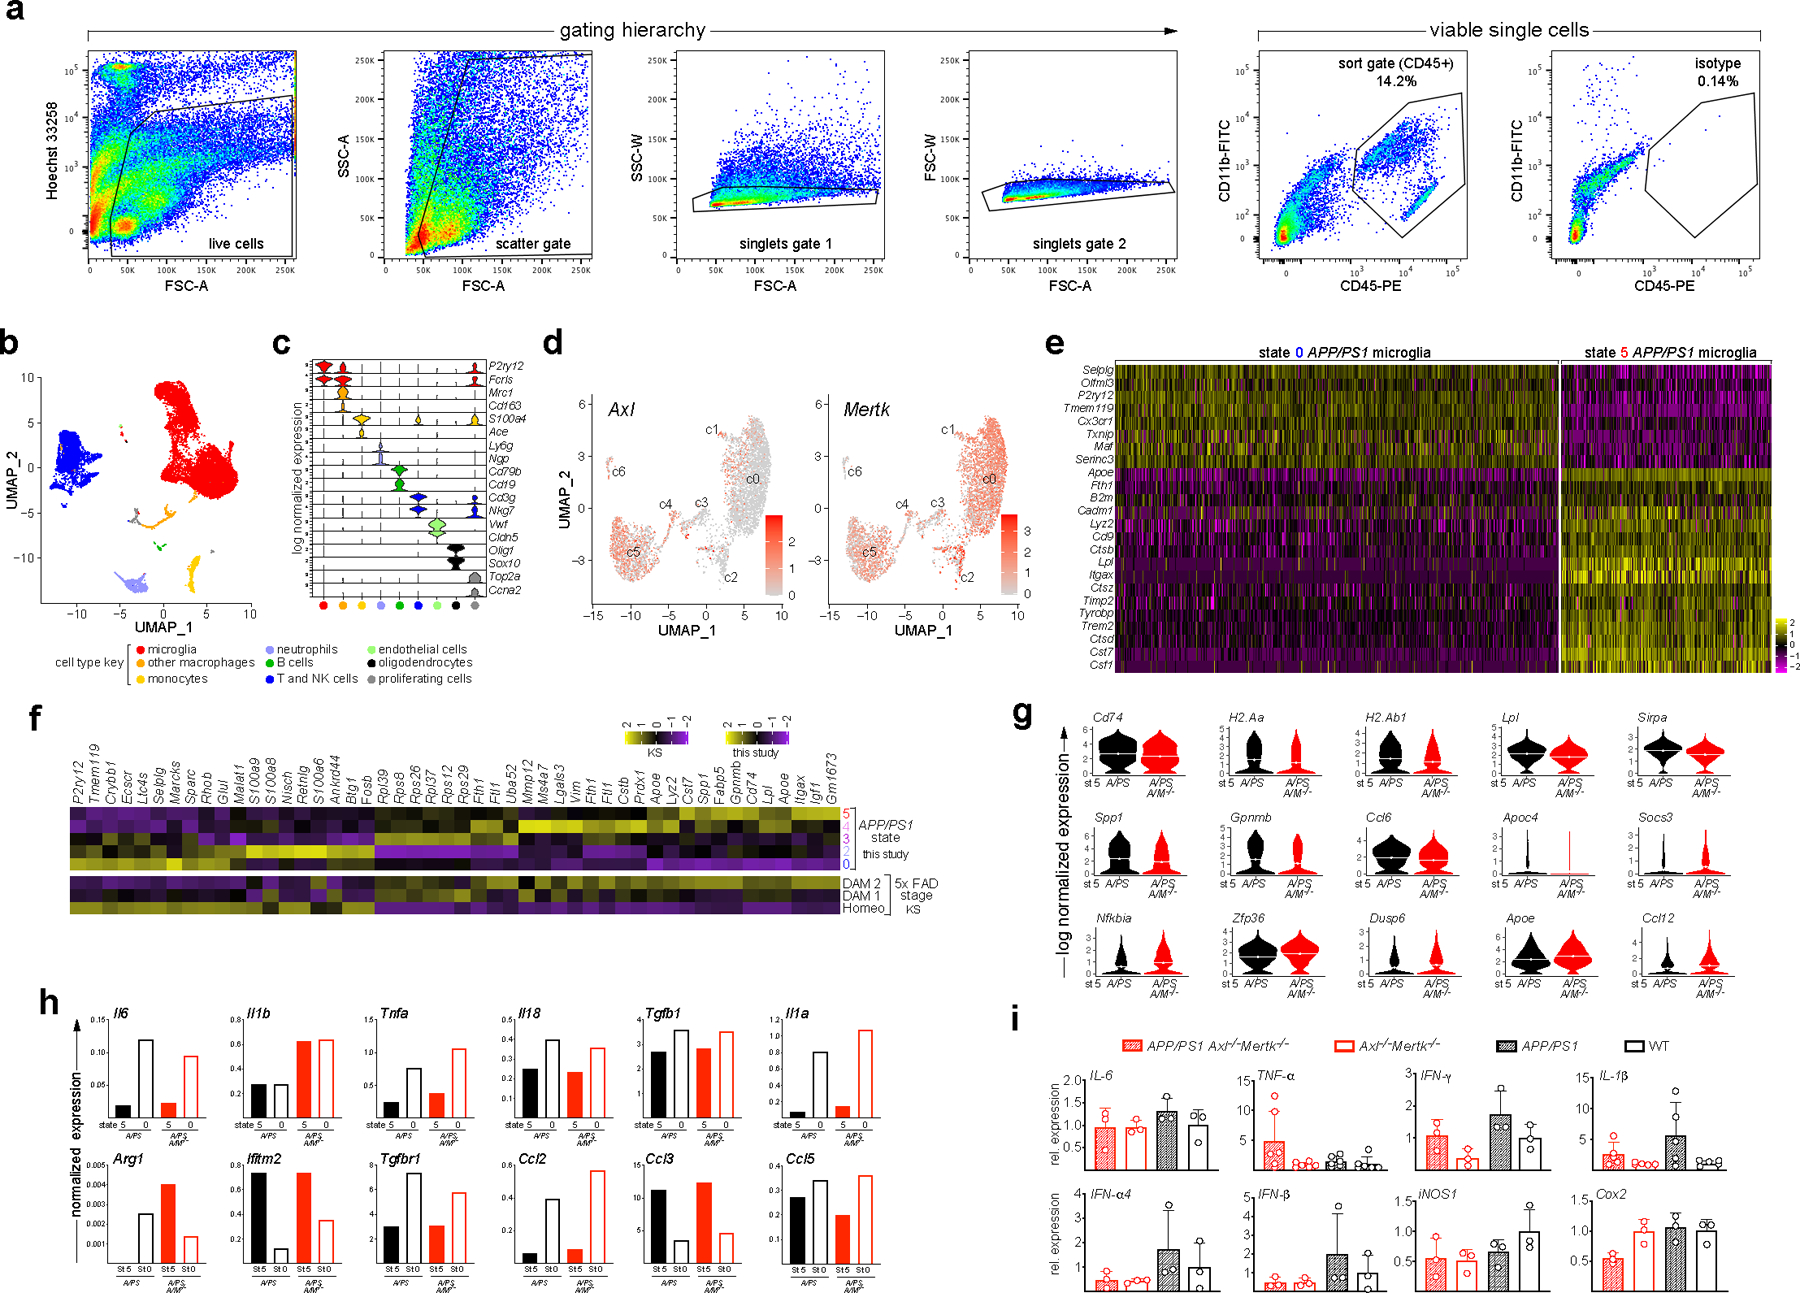
(a) Sorting scheme for isolation of CD45+ single cells. FSC and SSC, forward and side scatter, respectively. A, area; W, width. (b) Uniform manifold approximation and projection (UMAP) clustering of CD45+ cells sorted from 18 mo APP/PS1 (A/PS) and APP/PS1Axl−/−Mertk−/− (A/PS A/M−/−) cortices (combined) and annotated using the 18 marker genes in b. (c) Violin plots of population log-transformed normalized expression of the indicated genes in the indicated cell types. Cell type key applies to a and b. (d) Log-transformed normalized expression of Axl (left) and Mertk (right) mRNA in APP/PS1 cells within the microglial clusters defined in Fig. 3a. (e) Heat map of the scaled expression levels of the indicated genes in individual cells within transcriptomic state (cluster) 0 and state 5 microglia in the APP/PS1 cortex at 18 mo. (f) Comparative composite heat maps for the indicated genes across stages and transcriptomic states in 5xFAD and APP/PS1 mice, as quantified in this study (top five rows) and in Keren-Shaul et al.2 (bottom three rows), respectively. Values shown as z-scaled log-transformed normalized average of each group. (g) Violin plots of the log-transformed normalized expression distribution of the indicated genes at transcriptomic state 5 in A/PS (black) versus A/PS A/M−/− (red) microglia, as determined by single cell RNA-seq (scRNA-seq). Dotted lines indicate mean. (h) Mean expression level of the indicated cytokine and chemokine genes in state 5 versus state 0 microglia in A/PS (black) versus A/PS A/M−/− (red) microglia at 18 mo, as determined by scRNA-seq. (i) Relative expression level of the indicated inflammatory regulator mRNAs in RNA isolated from total cortex of mice of the indicated genotypes at 12 mo, as determined by qRT-PCR. n = 3–6. Kruskal-Wallis test with Dunn’s multiple comparison test. Data are represented as mean ±1 STD.