
Figure 2. Single cell analysis unveils unique human WAT-resident ILC subsets.
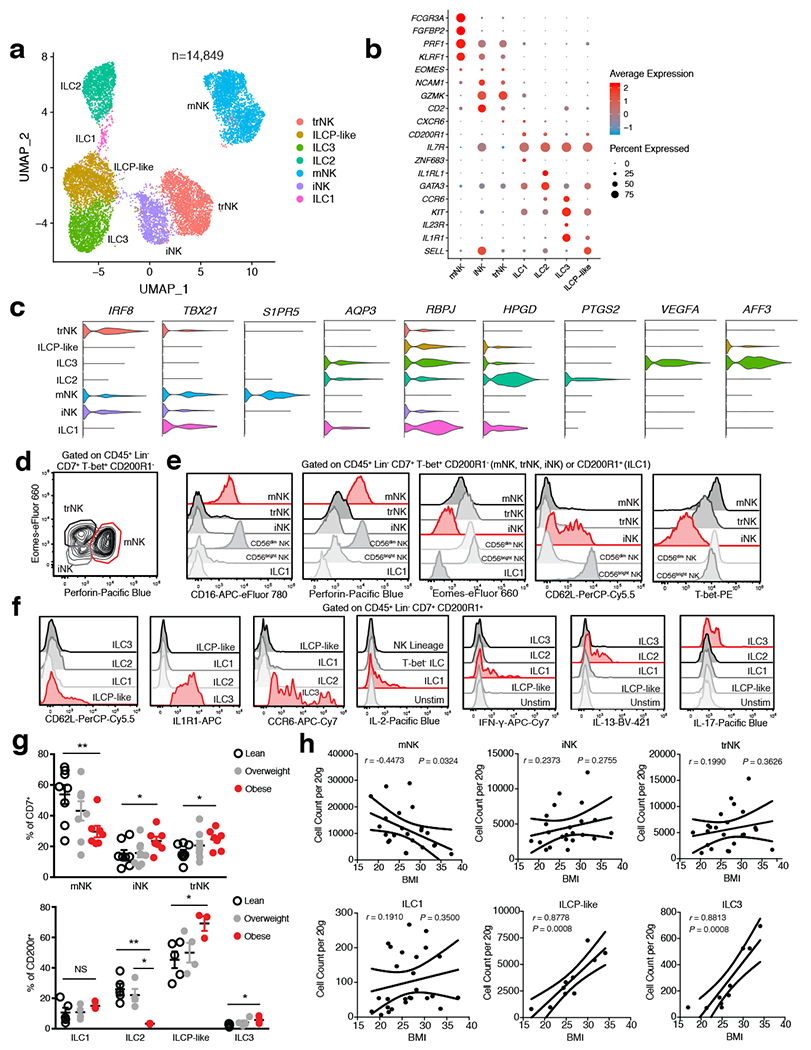
(a) UMAP plot of 14,849 human WAT CD45+Lin−CD7+CD200R1+ ILCs or CD45+Lin−CD7+CD200R1− NK cells isolated from the SVF of an independent cohort of 7 lean and 5 obese patients. Cluster analysis yields 7 distinct clusters comprising of ILCs and NK cells. (b) Dot plot showing selected top differentially expressed genes for the populations depicted. Color saturation indicates the strength of expression in positive cells, while dot size reflects the percentage of each cell cluster expressing the gene. (c) Violin plots showing RNA expression levels of selected cluster markers for indicated cell clusters. (d) Representative gating strategy for scRNAseq-defined human WAT NK cell populations (CD45+Lin−(CD3+TCRαβ+CD19+CD34+CD14+CD5+TCRγδ+)CD7+TBET+CD200R1−): mature NK (mNK): EOMES+PERFORIN+, tissue resident NK (trNK): EOMEShiPERFORINint, immature NK (iNK): EOMESloPERFORINint. (e) Representative histograms of CD16, Perforin, Eomes, CD62L, and T-bet expression on human WAT NK, ILC1 and CD56dim and CD56bright NK PBMC populations. (f) Representative histograms of CD62L, IL1R1, CCR6, IL-2, IFN-γ, IL-13, and IL-17 expression on human WAT ILC populations. Unstim refers to CD45+Lin−CD7+CD200R1+ cells cultured without PMA and Ionomycin. (g) Relative frequencies of innate lymphoid cell populations as a percentage of Lin−CD7+ cells (above; n=8 lean, n=8 overweight, and n=7 obese patients) or Lin−CD7+CD200R1+ cells (below; n=5 lean, n=4 overweight, and n=3 obese patients) isolated from the human WAT SVF. mNK: p=0.0065, iNK: p=0.0467, trNK: p=0.0138, ILC2 lean vs. obese: p=0.0032, ILC2 overweight vs. obese: p=0.0113, ILCP-like: p=0.0255, ILC3: p=0.0341. (h) Density correlation analysis of the depicted ILC types with patient BMI. Line of best fit and 95% confidence intervals are shown for each plot. (d-f) Data is representative of 3 individual patient samples. Each point represents an individual patient. Samples were compared using two-tailed Student’s t test with Welch’s correction, assuming unequal SD, and data are presented as individual points with the mean ± SEM (*p<0.05, **p<0.01). Linear regression and two-tailed Pearson Correlation analysis with 95% confidence intervals were conducted. p < 0.05 was considered significant.