
Figure 3. RNA velocity and CytoTRACE analysis identifies a shared ILC precursor to mature adipose ILC1 and ILC3.
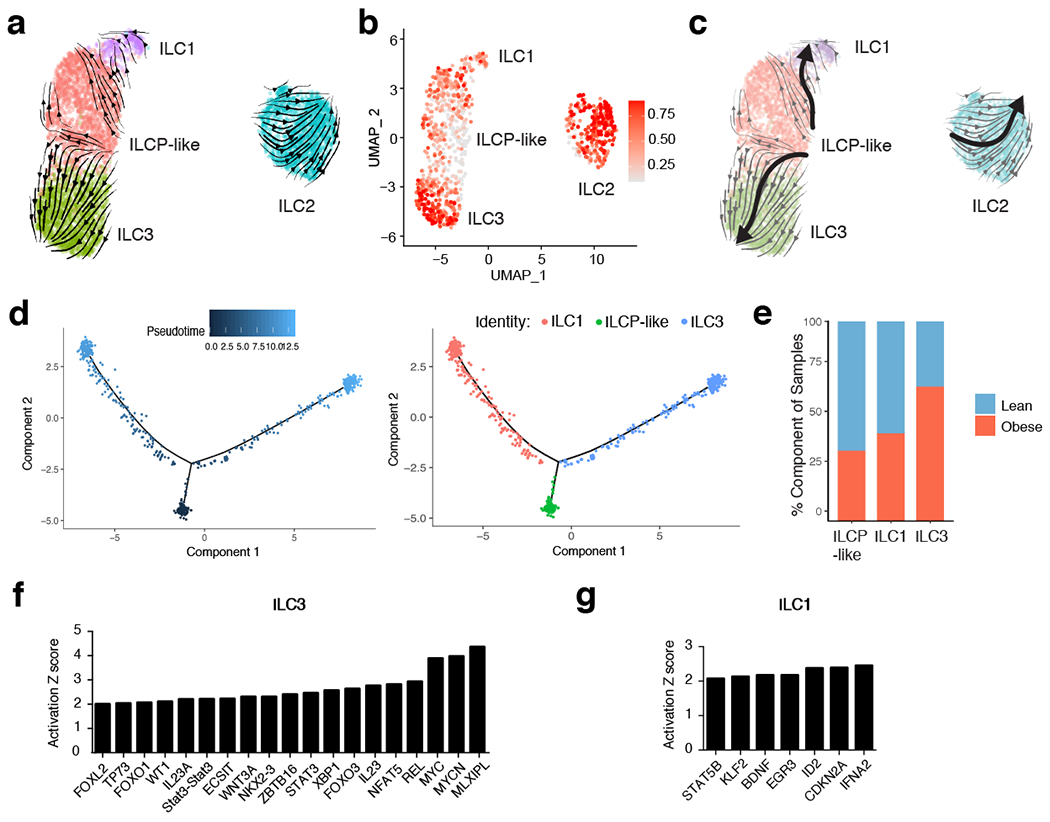
(a) RNA Velocity analysis of WAT ILC clusters with velocity field projected onto the UMAP plot of human adipose ILCs subclustered from Figure 2. Arrows show the local average velocity evaluated on a regular grid and indicate the extrapolated future states of cells. (b) CytoTRACE scatter plot of WAT ILC clusters. Color indicates the level of differentiation from low (grey) to high (red). (c) UMAP plot of WAT ILC clusters with velocity arrows and corresponding principal curve shown in bold. Principal curve indicates the manually averaged differentiation directionality projected by RNA Velocity and CytoTRACE analysis. (d) Monocle analysis of the ILCP-like, ILC1, and ILC3 populations indicating pseudotime directionality (left) and cell type (right); ILC1 (red), ILCP-like (green), ILC3 (blue). (e) Bar plots showing the proportion of the indicated ILC clusters derived from pooled 7 lean or 5 obese patients. (f,g) IPA Analysis of putative upstream regulators of the ILCP-like to ILC3 transition (f) or the ILCP-like to ILC1 transition (g).