
Figure 4. Single cell analysis identifies unique cell lineages within human WAT myeloid populations.
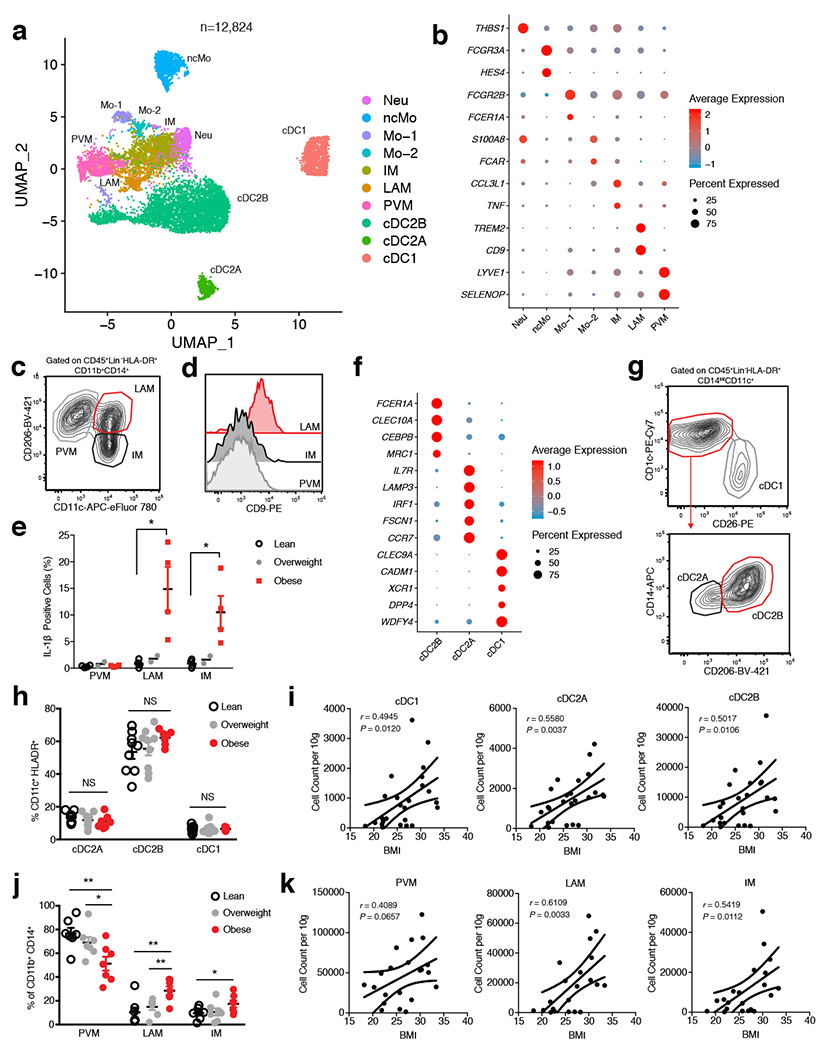
(a) UMAP plot of 12,824 pooled human adipose myeloid cells isolated from the SVF of 7 lean and 5 obese patients. Cluster analysis yields 10 distinct clusters comprising of DCs, macrophages, monocytes and neutrophils. (b) Dot plot showing selected top differentially expressed genes for the neutrophil, monocyte, and macrophage populations depicted. (c) Representative gating strategy for scRNAseq-defined human WAT macrophage populations (CD45+Lin−(CD3+TCRαβ+CD19+CD34+CD5+CD7+CD1c+)HLA-DR+CD11b+CD14+): Perivascular macrophage (PVM): CD206+CD11c−, Lipid-associated macrophage (LAM): CD206+CD11c+, Inflammatory macrophage (IM): CD206−CD11c+. (d) Representative flow cytometry histogram of CD9 expression on human WAT macrophage populations. (e) Flow cytometry analysis of endogenous IL-1β production by human WAT macrophage subsets from an additional n=4 lean, n=2 overweight, and n=4 obese patients. LAM: p=0.0158, IM: p=0.0204. Each point represents an individual patient. (f) Dot plot showing selected top differentially expressed genes for indicated DC subsets. (g) Representative gating strategy for scRNAseq-defined human WAT dendritic cell populations (CD45+Lin−(CD3+TCRαβ+CD19+CD34+CD7+CD16+CD88+CD89+)HLA-DR+CD14intCD11c+): conventional type 1 dendritic cell (cDC1): CD1c−CD26+, conventional type 2 dendritic cell A (cDC2A): CD1c+CD26−CD206−CD14int, conventional type 2 dendritic cell B (cDC2B): CD1c+CD26−CD206+CD14hi. (h) Relative frequencies of DC subsets as a percentage of Lin−CD11c+HLA-DR+ cells isolated from the SVF of WAT from n=9 lean, n=9 overweight, and n=7 obese patients. (i) Density correlation analysis of the depicted DC subsets with patient BMI. Line of best fit and 95% confidence intervals are shown for each plot. (j) Relative frequencies of macrophage populations as a percentage of Lin−CD11b+CD14+ cells isolated from the SVF of WAT from n= 7 lean, n=7 overweight, and n=7 obese patients. PVM lean vs. obese: p=0.0054, PVM overwieight vs. obese: p=0.0362, LAM lean vs. obese: p=0.0052, LAM overweight vs. obese: p=0.0088, IM: p=0.0404. (k) Density correlation analysis of the indicated macrophages with patient BMI. Line of best fit and 95% confidence intervals are shown for each plot. Each point represents an individual patient. (c,d,g) Data is representative of 3 individual patient samples. Samples were compared using two-tailed Student’s t test with Welch’s correction, assuming unequal SD, and data are presented as individual points with the mean ± SEM (*p<0.05, **p<0.01). Linear regression and two-tailed Pearson Correlation analysis with 95% confidence intervals were conducted. p < 0.05 was considered significant.