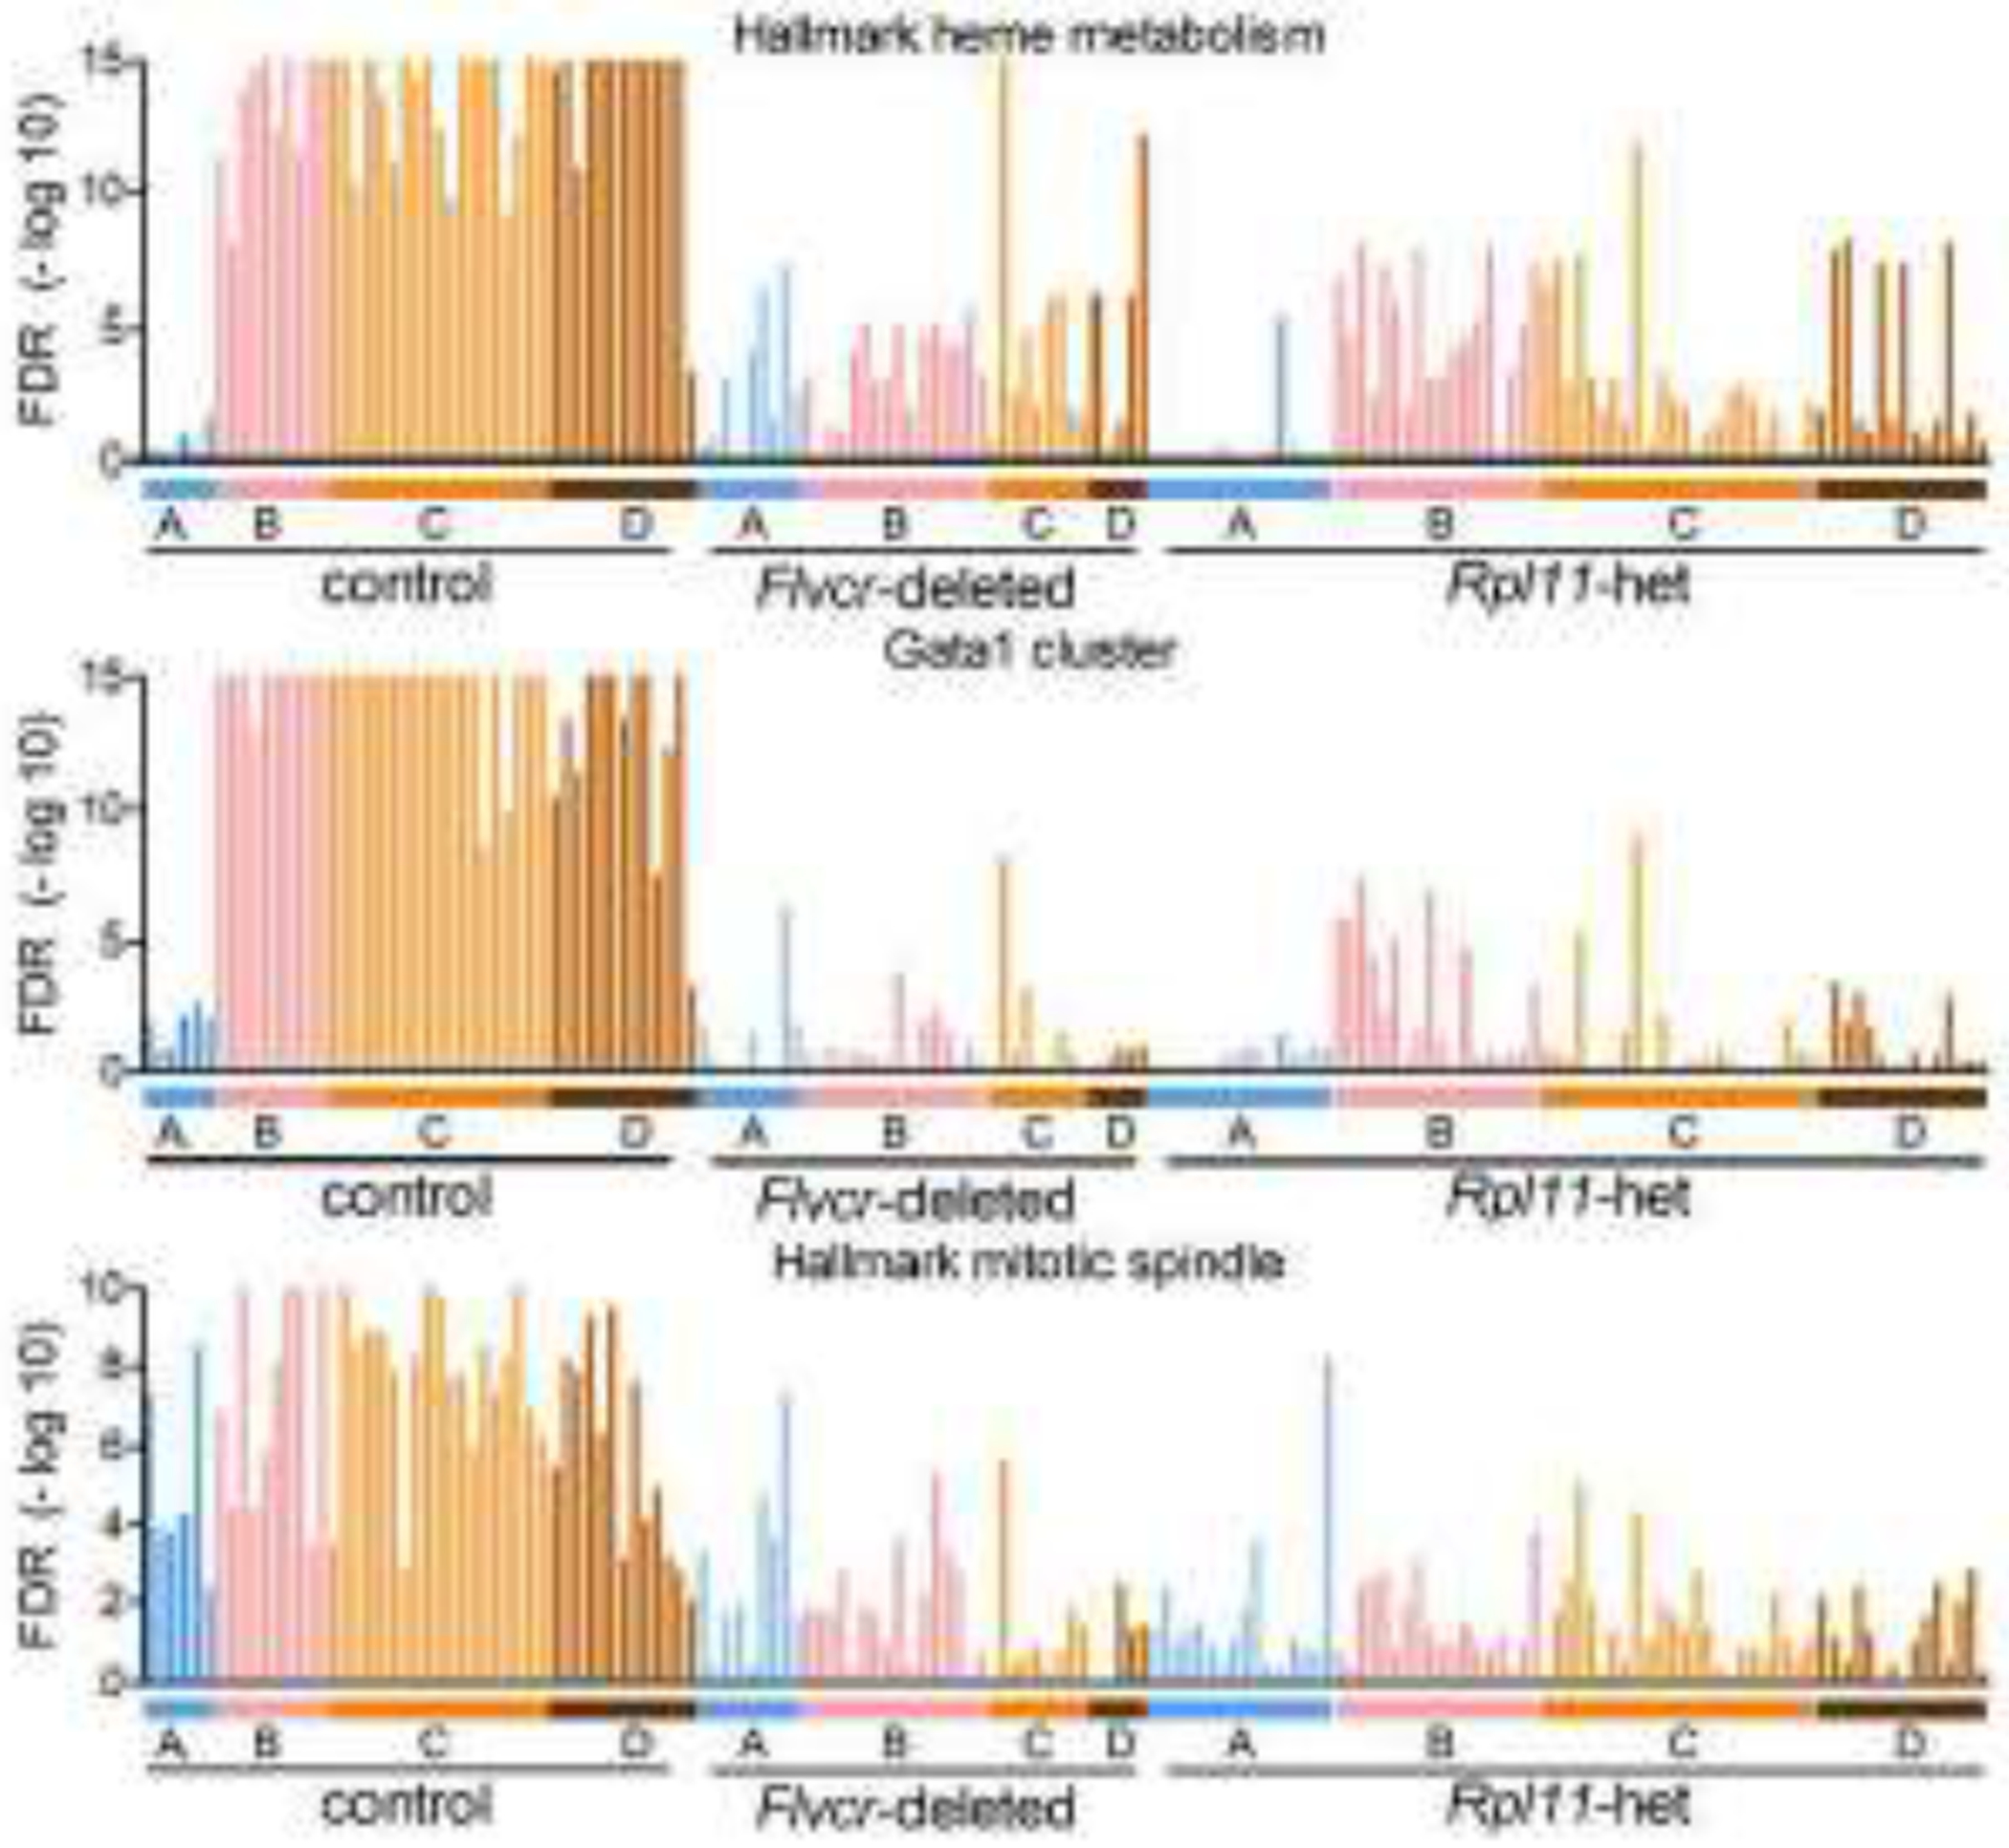
Figure 3. Transcriptional pathways downregulated by elevated heme in Rpl11 haploinsufficient mice.

GSEA enrichment levels for individual cells (BFU-E through basophilic erythroblasts) grouped according to clusters A-D from wildtype control mice, Flvcr1-deleted mice, and Rpl11 haploinsufficient mice shown as FDR plots for the hallmark heme metabolism, Gata1 cluster, and hallmark mitotic spindle pathways.
