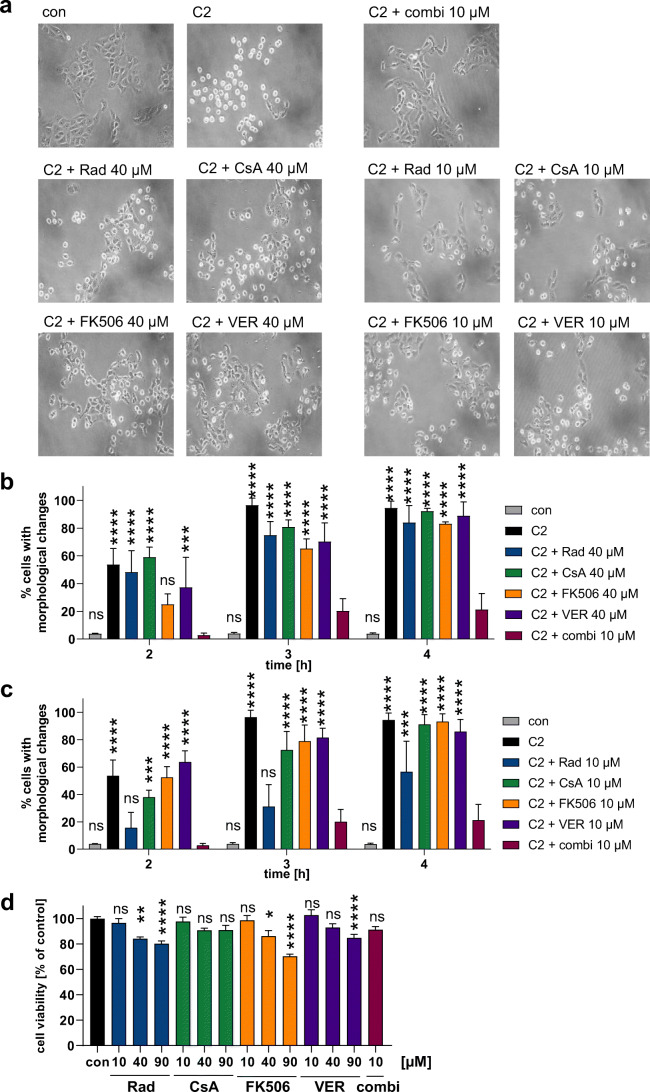
Fig. 5.
Inhibitor combination protects cells from C2 intoxication in reduced concentrations compared to single inhibitors. Vero cells were pre-incubated with single inhibitors (Rad, CsA, FK506, VER, 40 μM, or 10 μM) or with the combination of inhibitors (10 μM of each inhibitor). C2 toxin was added (50 ng/mL C2I + 100 ng/mL C2IIa) and cell morphology was monitored. (a) Cell images are shown exemplarily after 3 h of incubation with C2 toxin. Percentage of cells with morphological changes was determined from cell images. For better visualization, comparison of 40 μM of single inhibitors vs 10 μM of inhibitor combination are shown in (b) and comparison of 10 μM of single inhibitors vs 10 μM of inhibitor combination are shown in (c). Values for con, C2, and C2 + combi 10 μM are identical in both graphs. Values are given as mean ± SD (n = 3). Significance was tested using two-way ANOVA followed by Dunnett’s multiple comparison test. (****p ≤ 0.0001, ***p ≤ 0.001, ns, not significant vs C2 + combi 10 μM). (d) Vero cells were incubated with Rad, CsA, FK506, VER, or the combination of all four inhibitors at indicated concentrations for 6 h. Cell images were taken. Then, medium was exchanged to remove precipitation in the inhibitor samples and cell viability was measured by MTS assay. Values are given as mean ± SEM (n = 4 (triplicates from 4 independent experiments)). Significance was tested using one-way ANOVA followed by Dunnett’s multiple comparison test. (****p ≤ 0.0001, ***p ≤ 0.001, *p ≤ 0.05, ns, not significant vs con)

