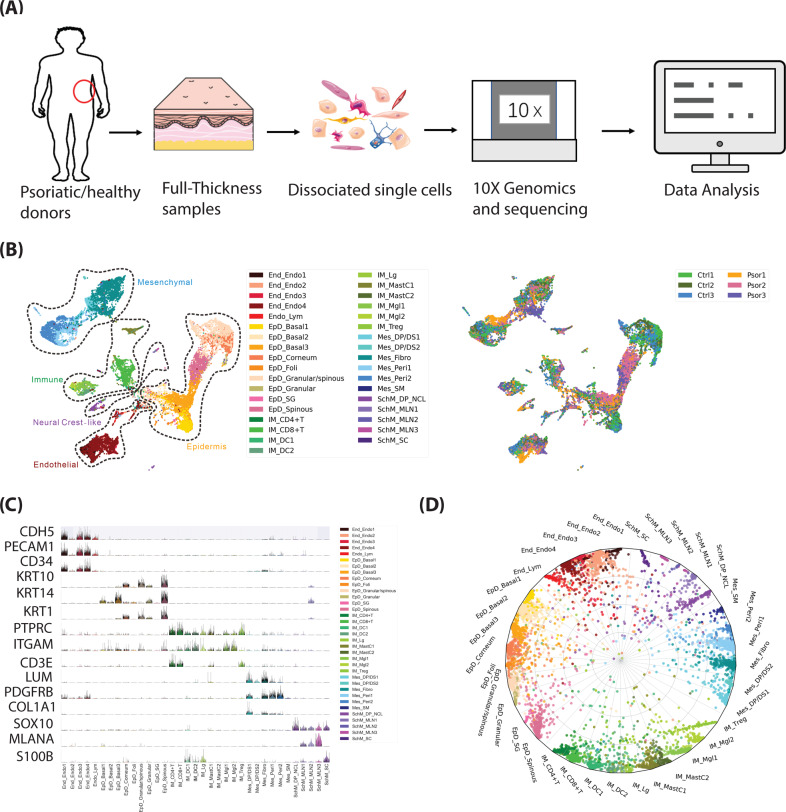
Fig. 1. Clustering, marker genes and cell type assignment of human full-thickness skin scRNAseq from healthy and psoriatic donors.
A Schematic view of the workflow. B Left, human full-thickness skin cell types. Visualization using UMAP of skin cells, each point represents one cell. Color coding based on unique cell clusters, as shown at right beside. Right, UMAP plot was folked from left side and colored by samples. Ctrl 1–3, samples from healthy donors; Psor 1–3, samples from patients with psoriasis vulgaris. C Expression of selected top significant marker genes for five main cell type clusters; relative expression of each gene in each cluster was visualized as violin plot, and the raw counts of each gene were visualized as sparkline plot in that violin plot. D Radar plot visualization of cell-type probabilistic scores of human full-thickness skin cells in relation to our defined cell types. Each dot represented one cell. Color coding based on unique cell clusters. The position of each dot indicated the cell-type score between that cell and the training (defined) cell types which were indicated outside of each bend in the radar wheel. Almost all cells were correctly assigned to their defined cell types.

