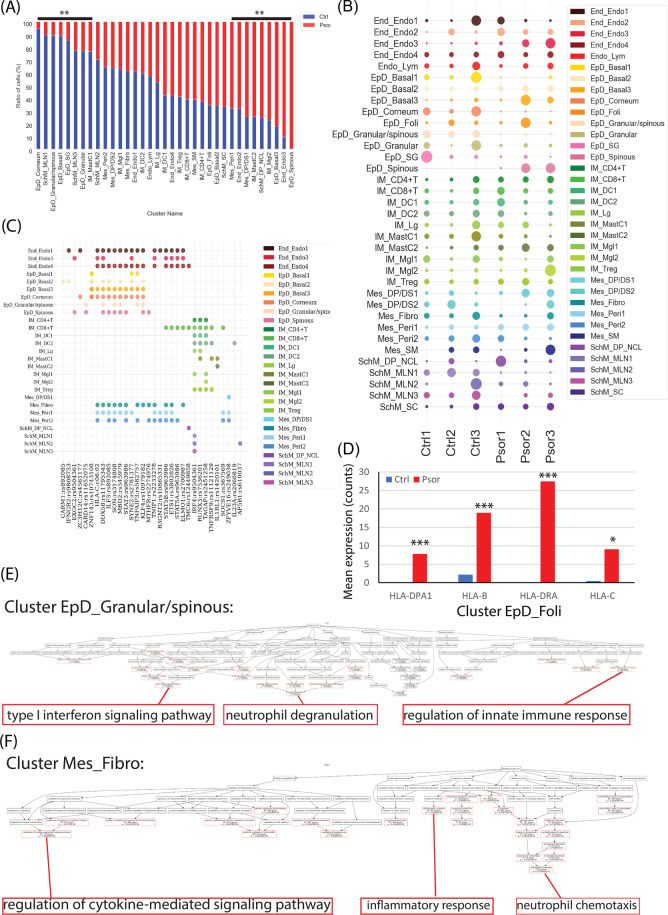
Fig. 3. The difference of cellular composition and cell-type-based transcription in psoriasis.
A Percentage bar plot of cell type composition in healthy and psoriatic skin, y-axis represented the percent of total cell number of that cell type. Red color represented psoriatic skin and blue color represented healthy control skin. Significant changes (FDR < 0.01) were labeled as ** on the top. B Dot plot of cell number distribution of each cell type in each healthy and psoriasis donor. Dot size represented the cell number percent of that donor (x-axis) in that cell type (y-axis). Color indicated the cell types. C Dot plot of the significant existence of each susceptibility gene loci (x-axis) in each cell type (y-axis). Color indicated each cell type. D Bar plot of the raw counted of four selected HLA genes in cell type EpD_Foli. Red color represented psoriatic skin and blue color represents healthy control skin. Y-axis represents the mean value of the expression raw counts. ***, FDR p < 0.001; *, p < 0.05. E, F GO-bioprocess enrichment plot of all psoriasis upregulated genes in cell type EpD_Granular/spinous (E) and Mes_Fibro (F). Red frame highlighted the significant enriched GO terms and the terminally enriched GO-bioprocess were enlarged at the bottom of each plot.

