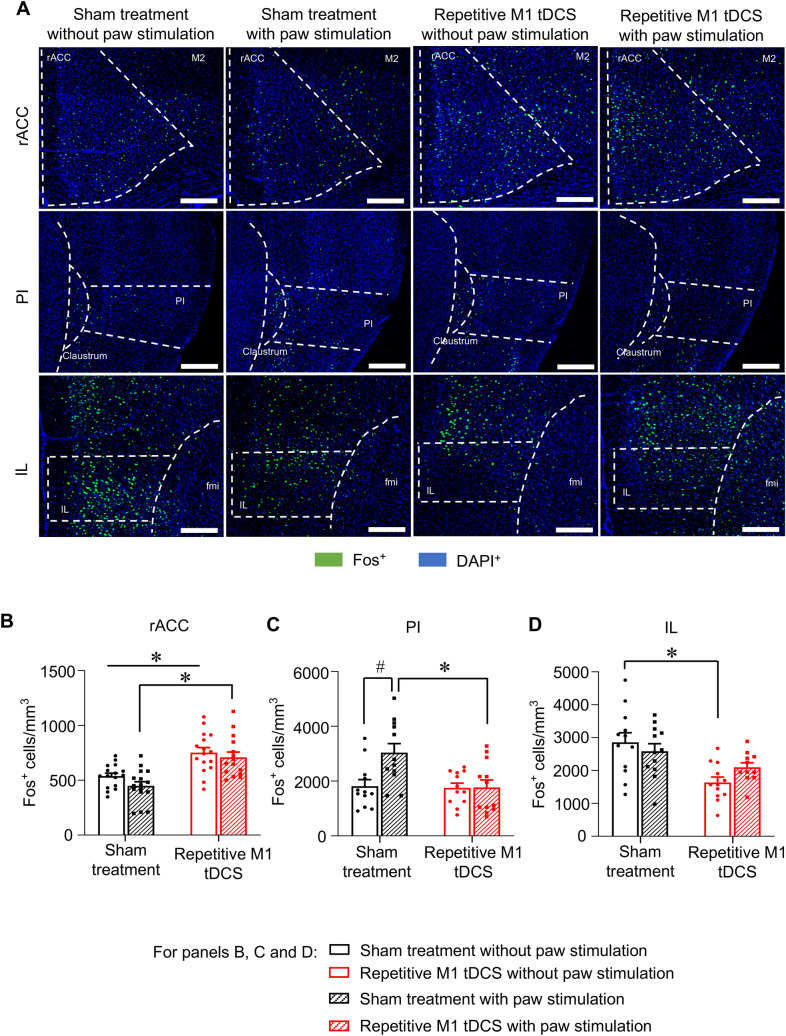
Figure 5.
Comparison of brain regions activated by hind paw stimulation with low intensity mechanical force (0.16 g; corresponding to neuropathic mechanical allodynia) at chronic stages of neuropathic pain (43 days post-nerve injury) in SNI mice receiving repetitive M1 tDCS or 0 mA sham stimulation over 35–39 days post-nerve injury. The control group received no mechanical stimulation (control). (A) Typical examples of immunohistochemistry for the neuronal activity marker protein Fos with nuclear counterstaining with DAPI (scale bar = 100 µm), images were acquired with a confocal laser-scanning microscope (Leica LAS X, version 3.3.0), imported to Fiji-Image J software (version 1.50b). (B–D) Quantitative analysis of Fos-expressing cells over the rostral anterior cingulate cortex (rACC, B), posterior insula (PI, C) and infralimbic cortex (IL, D); n = 15–16 sections from 4 mice per group, ANOVA for random measures was performed, followed by Sidak’s test for multiple comparisons. *Indicates p < 0.05 as compared to the corresponding sham treatment group, # indicates p < 0.05 as compared to control in the sham treatment group and repetitive M1 tDCS group. Data are represented as mean ± S.E.M.

