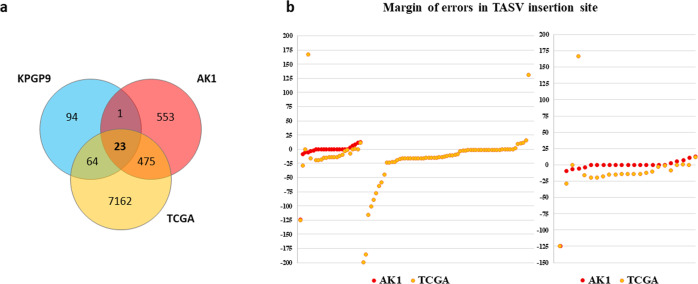
Fig. 3. Comparisons of TASV insertions among three genome datasets.
a The numbers of TASV insertions were compared between KPGP9, another Korean genome (AK1), and TCGA genome data. Only 23 loci were shared among the three genome datasets, and 94 were unique to KPGP9. b The red and orange dots represent the margin of error in the TASV insertion points of AK1 and TCGA data, respectively, based on the TASV insertion points detected in the KPGP genome. The left side shows the margin of error for 88 common TASV insertions to KPGP, and the right side shows the margin of error for 23 TASV insertions shared in both genome datasets.

