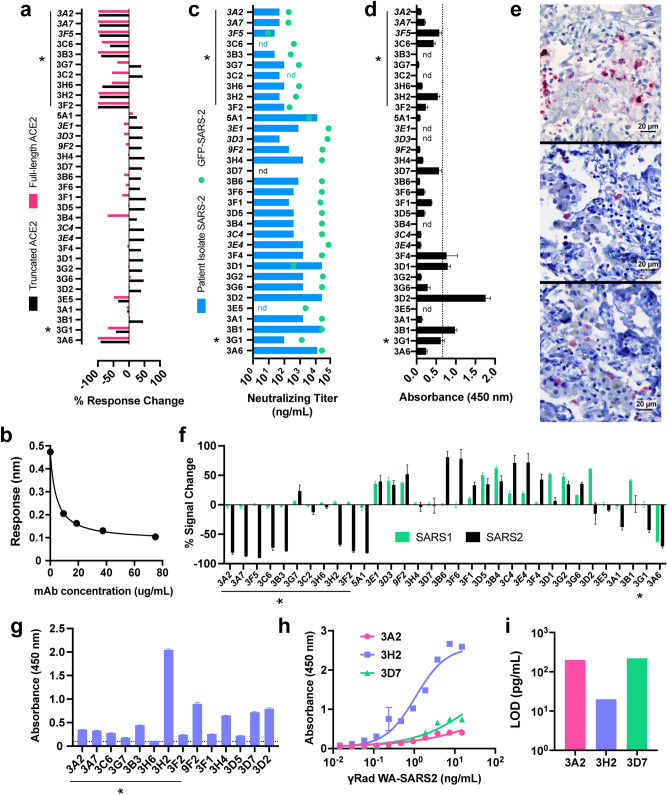
Figure 4.
Functional utility of SARS-CoV-2 mAbs. (a) Assessment of inhibition of S1 RBD binding to human ACE2 receptor as measured by BLI, performed at a single antibody concentration. Both full-length ACE2 (residues #1-740, pink bars) and truncated ACE2 (residues #1-614, black bars) were included. Data represents percent of signal change normalized to response of ACE2/RBD binding with no mAb present, error bars represent standard deviation of technical replicates. Neutralizing antibodies in both assays are denoted by asterisks; adjacent mAbs in italics are identical. (b) Representative (mAb 3G7) dose-dependent antibody-mediated inhibition of ecto-Spike binding to full-length human ACE2 receptor; readout is the wavelength shift in nm in the BLI interferometric response20,21. (c) In vitro mAb neutralization of SARS-CoV-2 USA/WA1/2020 virus (blue bars) or of GFP-expressing SARS-CoV-2 (green dots). Asterisks mark particularly effective entries. (d) Binding of antibodies to biotinylated peptide (amino acids 486–501 with C488S substitution; containing four out of five reported RBD-hACE2 contacts) plated on streptavidin-coated plates as measured by ELISA. Dashed line represents the average plus twice the standard deviation of the values obtained for replicates involving three identical mAbs (3A2, 3A7, 3F5); error bars = standard deviation. (e) Immunohistochemical staining of lung tissue from an early confirmed SARS-CoV-2 fatal case by (top) known SARS polyclonal nucleocapsid antibody22, (middle) mAbs 3D2, and (bottom) 3D7 (1:100 mAb dilution, antigen detection in red). (f) Specificity of mAbs determined by split nanoluciferase assay including either SARS1 or SARS2 RBD incubated with mAb followed by ACE2, normalized to ACE2/RBD signal without antibody. Negative values denote inhibition, positive indicate binding enhancement observed only with truncated ACE2. (g) ELISA detection of mAb binding to gamma-inactivated SARS-COV-2 (1 µg/mL TCID50 units plated); dotted line denotes background signal. (h) Dose-dependent gamma-inactivated SARS-COV-2 binding of select mAbs (5 µg/mL mAb) measured by ELISA, sigmoidal dose–response curve fitted by GraphPad Prism8. (i) Limit of detection quantification of mAbs in panel g. LOD calculated as the minimum virus concentration giving rise to a signal equivalent to the mean background signal plus 3 experimental standard deviations (GraphPad Prism 8).

