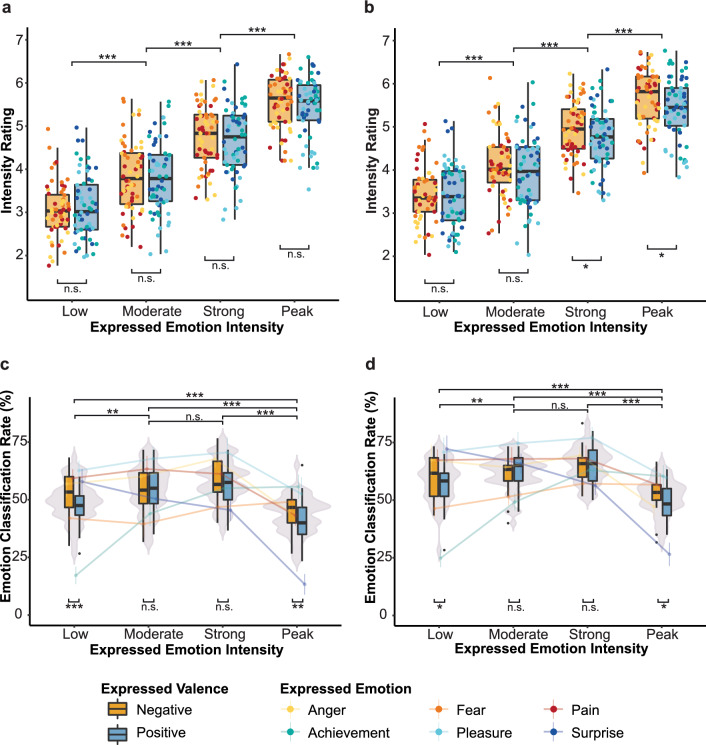
Figure 3.
Paradoxical role of intensity. (a,b) Show positive relation of expressed and perceived intensity in Experiment 1(a) and 2 (b). Stimuli (dots) are grouped by expressed valence, emotion and intensity. (c,d) Show emotion classification accuracy as a function of valence, emotion, and intensity in Experiment 1(c) and 2(d). Violin plots represent the effect of intensity on correct emotion classification, box plots represent the interaction of valence and intensity, and lines represent the interaction of emotion and intensity on correct emotion classification. Error bars indicate 95% confidence intervals. n.s. = non-significant. *p < 0.05. **p < 0.01. ***p < 0.001. Figure created with R version 4.0.335.

